Architecture
Control Plane
The Linkerd control plane is a set of services that run in a dedicatedKubernetes namespace (linkerd by default). These services accomplish variousthings—aggregating telemetry data, providing a user-facing API, providingcontrol data to the data plane proxies, etc. Together, they drive the behaviorof the data plane. The CLI can be used toinstall the control plane.
The control plane is made up of four components:
Controller - The controller deployment consists of multiple containers(public-api, proxy-api, destination, tap) that provide the bulk of the controlplane’s functionality.
Web - The web deployment provides the Linkerd dashboard.
Prometheus - All of the metrics exposed by Linkerd are scraped via Prometheusand stored here. This is an instance of Prometheus that has been configured towork specifically with the data that Linkerd generates. There areinstructionsif you would like to integrate this with anexisting Prometheus installation.
Grafana - Linkerd comes with many dashboards out of the box. The Grafanacomponent is used to render and display these dashboards. You can reach thesedashboards via links in the Linkerd dashboard itself.
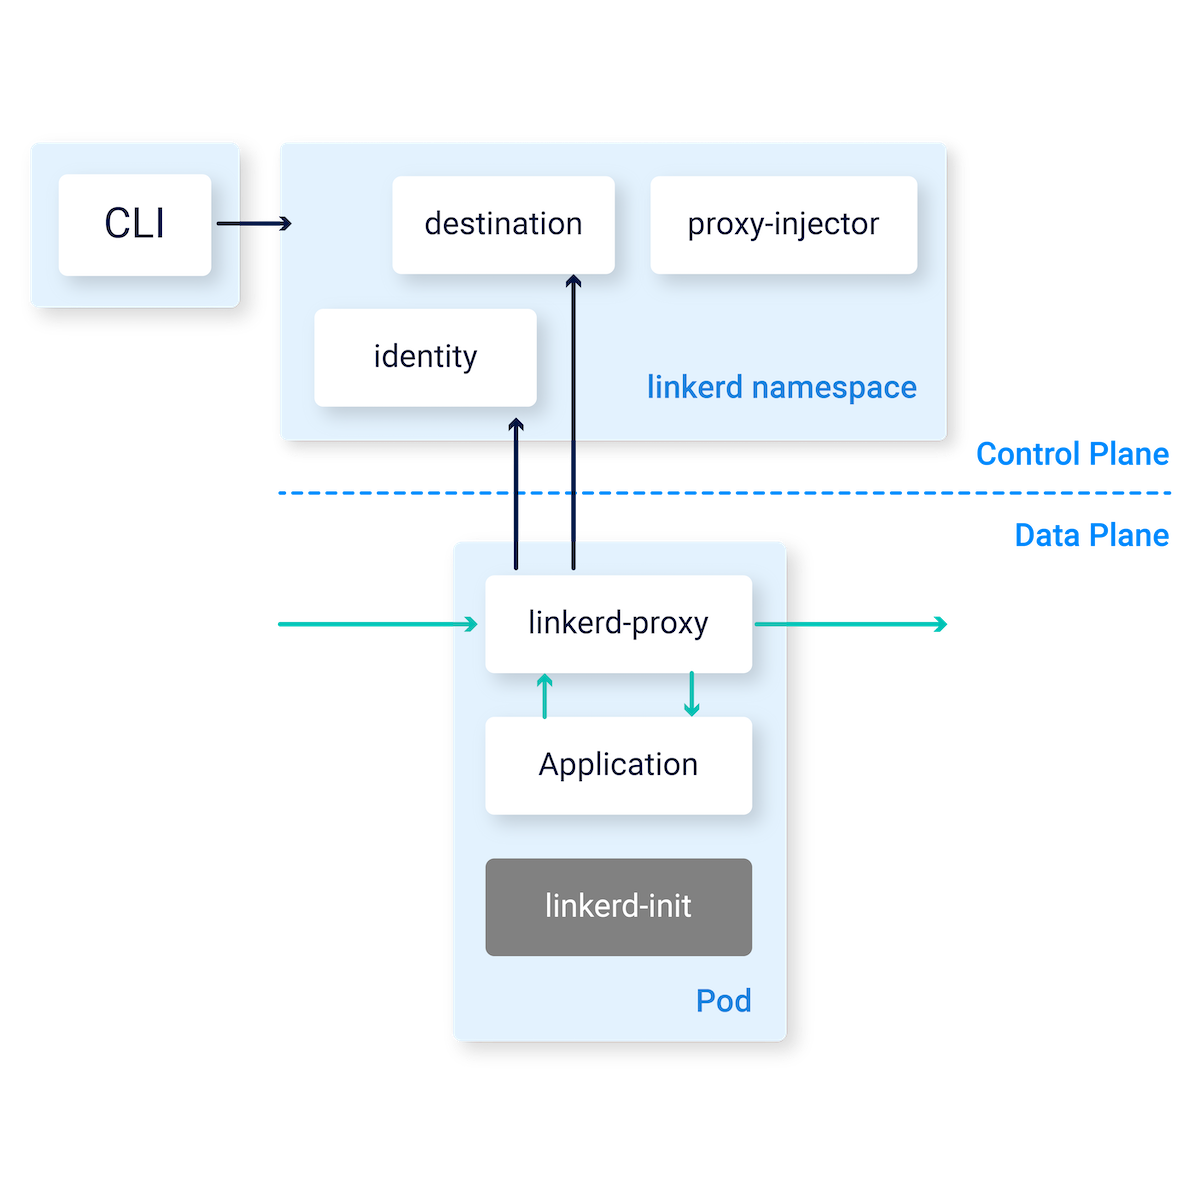
Data Plane
The Linkerd data plane is comprised of lightweight proxies, which are deployedas sidecar containers alongside each instance of your service code. In order to“add” a service to the Linkerd service mesh, the pods for that service must beredeployed to include a data plane proxy in each pod. (The linkerd injectcommand accomplishes this, as well as the configuration work necessary totransparently funnel traffic from each instance through the proxy.) You canadd your service to the data plane with a single CLIcommand.
These proxies transparently intercept communication to and from each pod, andadd features such as instrumentation and encryption (TLS), as well as allowingand denying requests according to the relevant policy.
These proxies are not designed to be configured by hand. Rather, their behavioris driven by the control plane.
Proxy
An ultralight transparent proxy written in Rust,the proxy is installed into each pod of a service and becomes part of the dataplane. It receives all incoming traffic for a pod and intercepts all outgoingtraffic via an initContainer that configures iptables to forward thetraffic correctly. Because it is a sidecar and intercepts all the incoming andoutgoing traffic for a service, there are no code changes required and it caneven be added to a running service.
The proxy’s features include:
Transparent, zero-config proxying for HTTP, HTTP/2, and arbitrary TCPprotocols.
Automatic Prometheus metrics export for HTTP and TCP traffic.
Transparent, zero-config WebSocket proxying.
Automatic, latency-aware, layer-7 load balancing.
Automatic layer-4 load balancing for non-HTTP traffic.
Automatic TLS (experimental).
An on-demand diagnostic tap API.
The proxy supports service discovery via DNS and thedestination gRPC API.
CLI
The Linkerd CLI is run locally on your machine and is used to interact with thecontrol and data planes. It can be used to view statistics, debug productionissues in real time and install/upgrade the control and data planes.
Dashboard
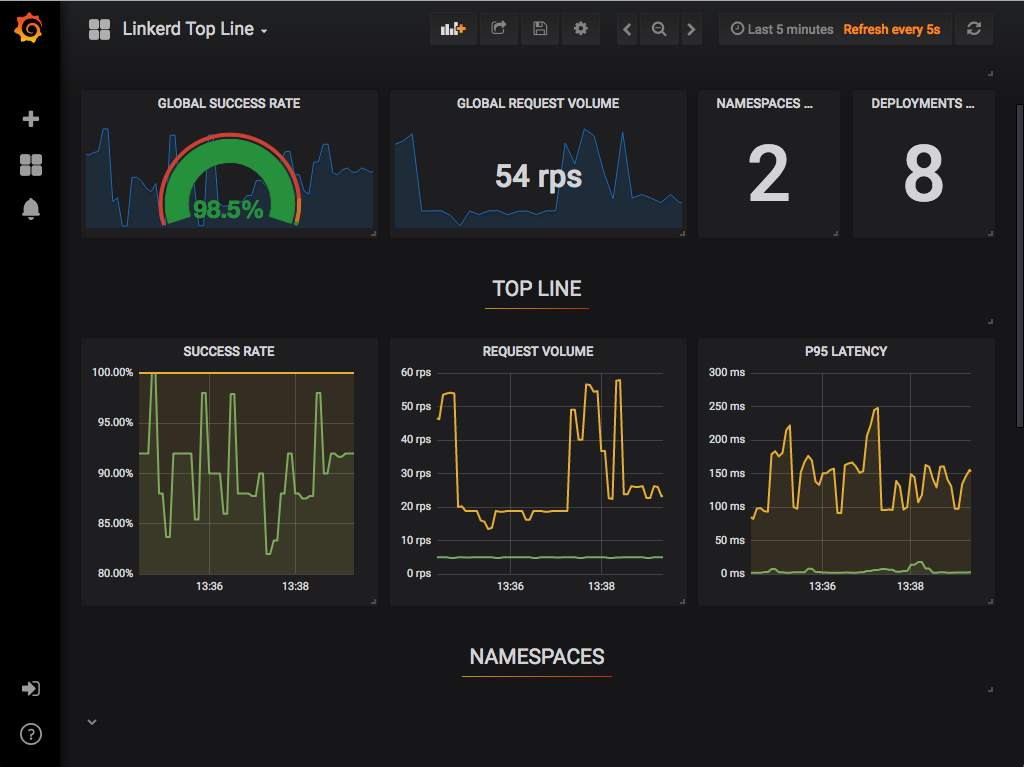
The Linkerd dashboard provides a high level view of what is happening with yourservices in real time. It can be used to view the “golden” metrics (successrate, requests/second and latency), visualize service dependencies andunderstand the health of specific service routes. One way to pull it up is byrunning linkerd dashboard from the command line.

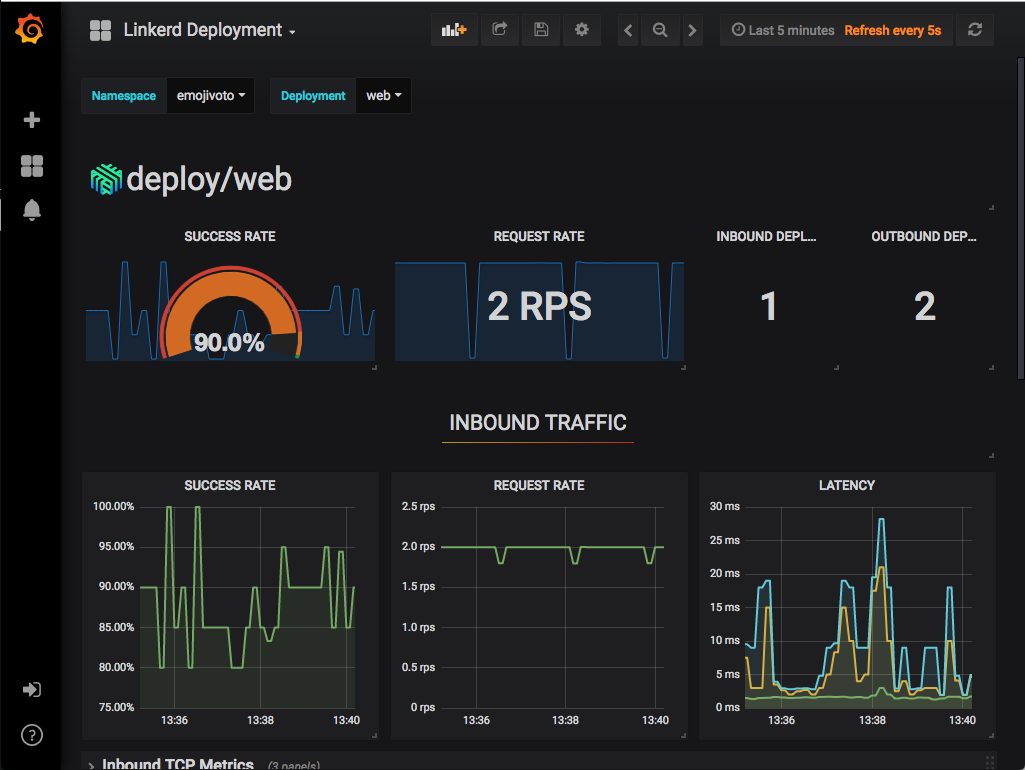
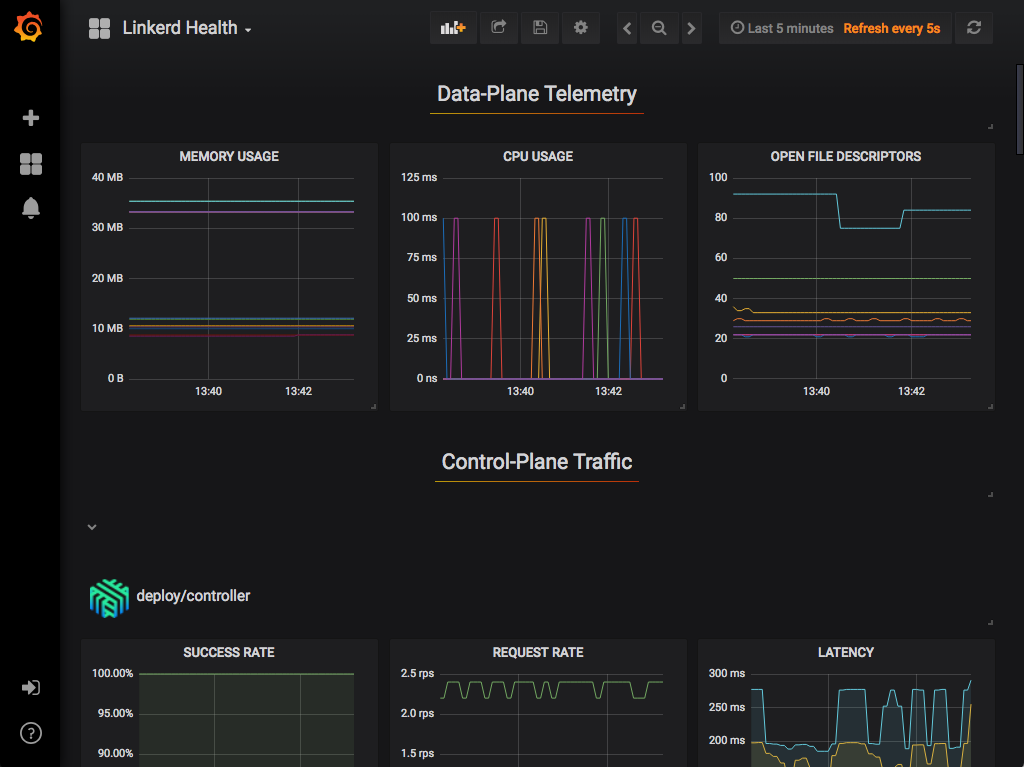
Grafana
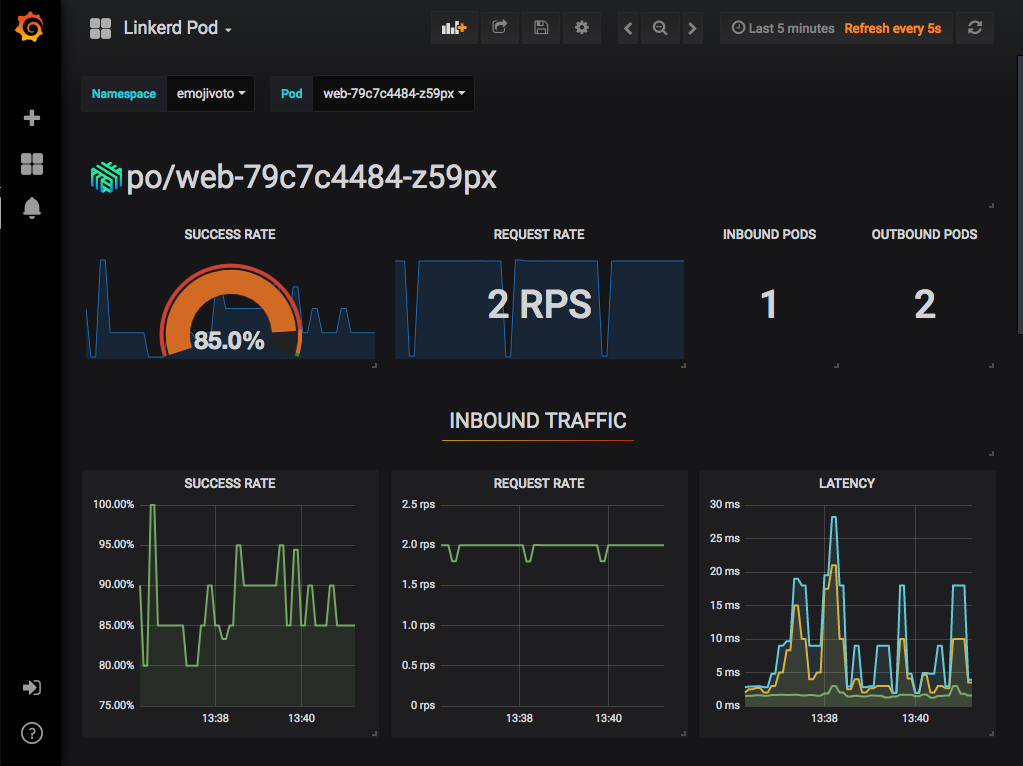
As a component of the control plane, Grafana provides actionable dashboards foryour services out of the box. It is possible to see high level metrics and digdown into the details, even for pods.
The dashboards that are provided out of the box include:
Prometheus
Prometheus is a cloud native monitoring solution that is used to collectand store all the Linkerd metrics. It is installed as part of the control planeand provides the data used by the CLI, dashboard and Grafana.
The proxy exposes a /metrics endpoint for Prometheus to scrape on port 4191.This is scraped every 10 seconds. These metrics are then available to all theother Linkerd components, such as the CLI and dashboard.