Jaeger
完成此任务后,您将了解如何让您的应用程序参与 Jaeger的追踪,而不管您用来构建应用程序的语言、框架或平台是什么。
此任务使用 Bookinfo 作为演示的应用程序。
要了解 Istio 如何处理追踪,请查看这个任务的概述。
开始之前
- 要设置 Istio,按照安装指南中的说明进行操作。
a) 通过设置 —set values.tracing.enabled = true 安装选项以启用 tracing 的“开箱即用”的演示/测试环境
b) 通过使用现有 Jaeger 实例(例如使用 operator进行创建,然后设置—set values.global.tracer.zipkin.address = <jaeger-collector-service>.<jaeger -collector-namespace>:9411 的安装选项。
启用跟踪时,可以设置 Istio 用于跟踪的采样率。使用这个 values.pilot.traceSampling 选项设置采样率。默认的采样率为 1%.
- 部署 Bookinfo 示例应用程序。
访问仪表盘
远程访问遥测插件详细介绍了如何通过网关配置对 Istio 插件的访问。或者,如果要使用 Kubernetes ingress,请在安装过程中指定选项 —set values.tracing.ingress.enabled = true。
对于测试(或临时访问),您也可以使用端口转发。假设已将 Jaeger 部署到 “istio-system” 命名空间,请使用以下内容:
$ kubectl -n istio-system port-forward $(kubectl -n istio-system get pod -l app=jaeger -o jsonpath='{.items[0].metadata.name}') 15032:16686
打开您的浏览器并访问 http://localhost:15032。
使用 Bookinfo 示例产生追踪
当 Bookinfo 应用程序启动并运行时,访问
http://$GATEWAY_URL/productpage一次或多次以生成追踪信息。从仪表盘左边面板的 Service 下拉列表中选择
productpage并点击 Find Traces:
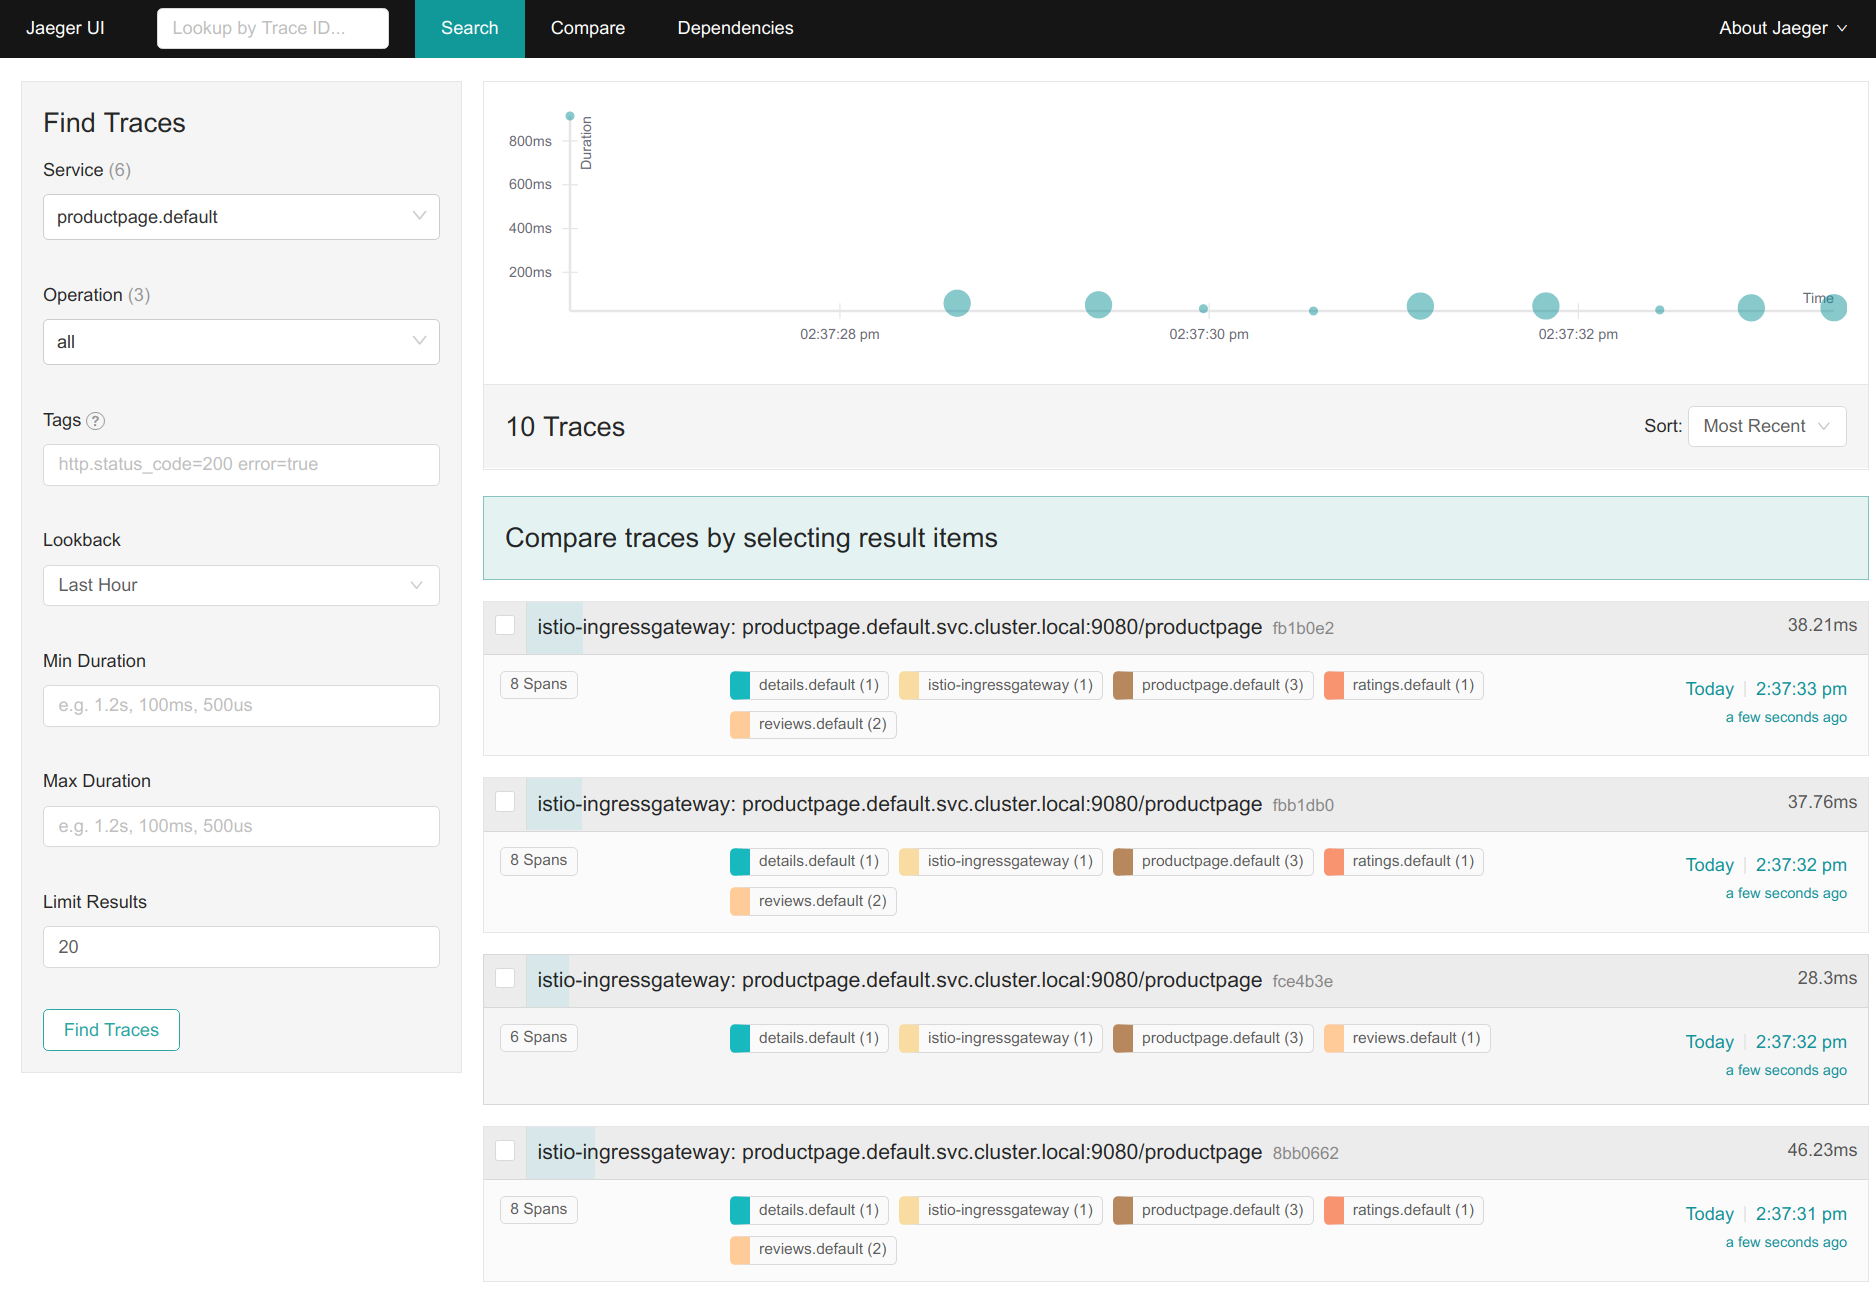 追踪仪表盘
追踪仪表盘
- 点击位于最上面的最近一次追踪,查看对应最近一次访问
/productpage的详细信息:
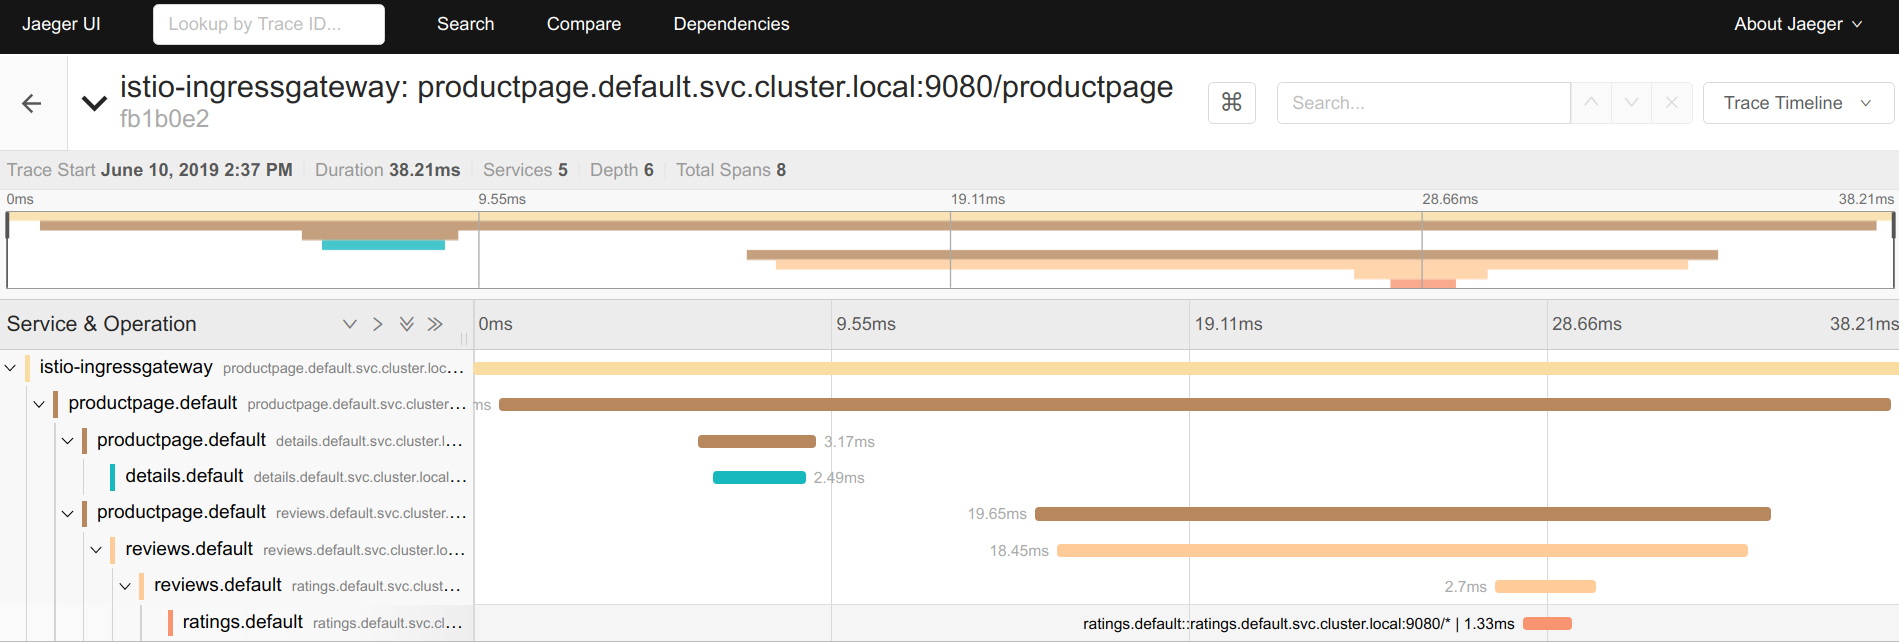 详细追踪视图
- 追踪信息由一组 span 组成,每个 span 对应一个 Bookinfo service。这些 service 在执行
/productpage请求时被调用,或是 Istio 内部组件,例如:istio-ingressgateway
清理
- 停止任何可能还在运行的
kubectl port-forward进程:
$ killall kubectl
- 如果您没有计划探索任何接下来的任务,请参考 Bookinfo 清理中的说明,关闭整个应用程序。
相关内容
Learn how to configure the proxies to send tracing requests to Zipkin.
Remotely Accessing Telemetry Addons
This task shows you how to configure external access to the set of Istio telemetry addons.
How to configure the proxies to send tracing requests to LightStep.
Overview of distributed tracing in Istio.
Improving availability and reducing latency.
Provides an overview of Mixer's plug-in architecture.