
Querying Metrics from Prometheus
This task shows you how to query for Istio Metrics using Prometheus. As part of this task, you will use the web-based interface for querying metric values.
The Bookinfo sample application is used as the example application throughout this task.
Before you begin
- Install Istio in your cluster.
- Install the Prometheus Addon.
- Deploy the Bookinfo application.
Querying Istio metrics
Verify that the
prometheusservice is running in your cluster.In Kubernetes environments, execute the following command:
$ kubectl -n istio-system get svc prometheusNAME TYPE CLUSTER-IP EXTERNAL-IP PORT(S) AGEprometheus ClusterIP 10.109.160.254 <none> 9090/TCP 4m
Send traffic to the mesh.
For the Bookinfo sample, visit
http://$GATEWAY_URL/productpagein your web browser or issue the following command:$ curl "http://$GATEWAY_URL/productpage"
$GATEWAY_URLis the value set in the Bookinfo example.Open the Prometheus UI.
In Kubernetes environments, execute the following command:
$ istioctl dashboard prometheus
Click Graph to the right of Prometheus in the header.
Execute a Prometheus query.
In the “Expression” input box at the top of the web page, enter the text:
istio_requests_total
Then, click the Execute button.
The results will be similar to:
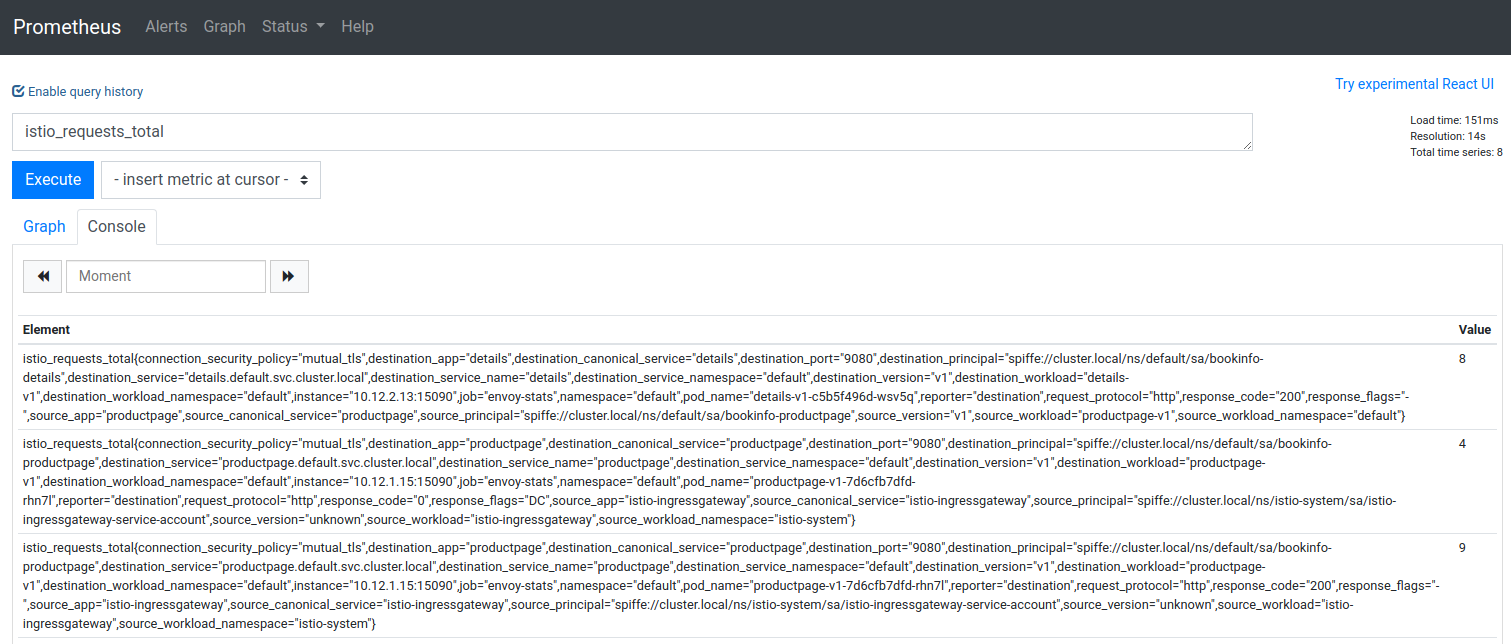
Prometheus Query Result
You can also see the query results graphically by selecting the Graph tab underneath the Execute button.
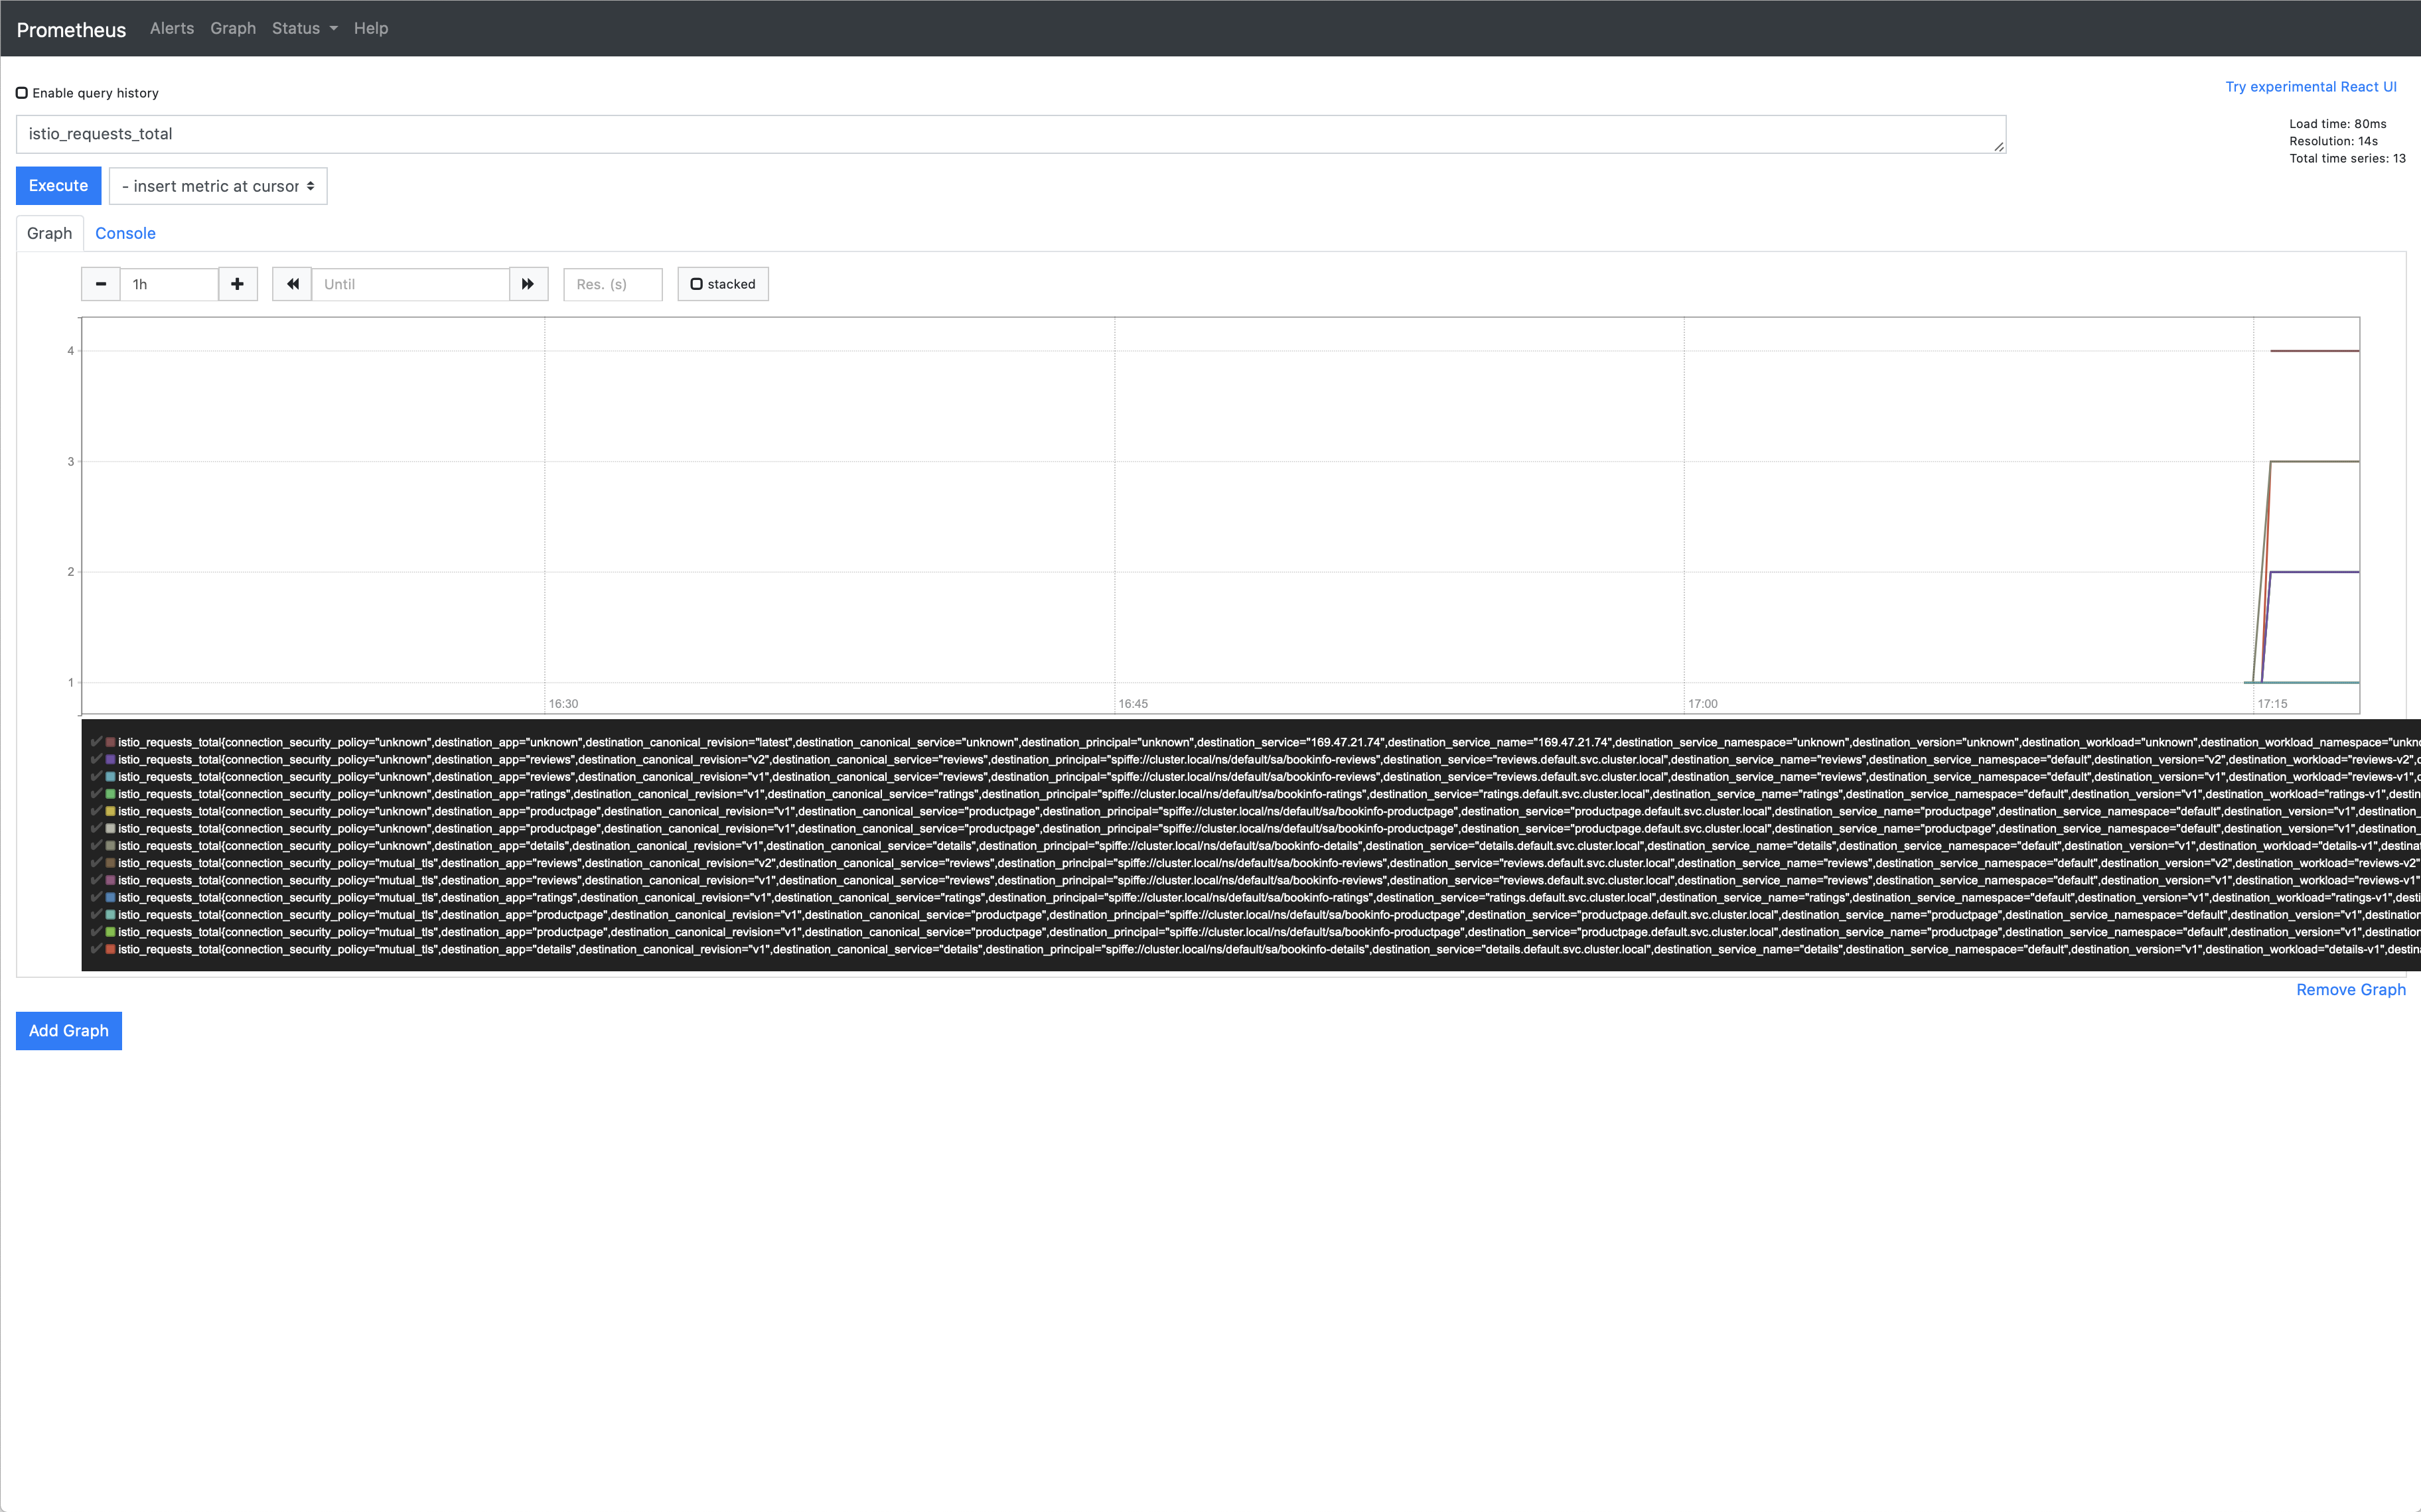
Prometheus Query Result - Graphical
Other queries to try:
Total count of all requests to the
productpageservice:istio_requests_total{destination_service="productpage.default.svc.cluster.local"}
Total count of all requests to
v3of thereviewsservice:istio_requests_total{destination_service="reviews.default.svc.cluster.local", destination_version="v3"}
This query returns the current total count of all requests to the v3 of the
reviewsservice.Rate of requests over the past 5 minutes to all instances of the
productpageservice:rate(istio_requests_total{destination_service=~"productpage.*", response_code="200"}[5m])
About the Prometheus addon
The Prometheus addon is a Prometheus server that comes preconfigured to scrape Istio endpoints to collect metrics. It provides a mechanism for persistent storage and querying of Istio metrics.
For more on querying Prometheus, please read their querying docs.
Cleanup
Remove any
istioctlprocesses that may still be running using control-C or:$ killall istioctl
If you are not planning to explore any follow-on tasks, refer to the Bookinfo cleanup instructions to shutdown the application.
See also
Classifying Metrics Based on Request or Response (Experimental)
This task shows you how to improve telemetry by grouping requests and responses by their type.
This task shows you how to configure Istio’s Mixer to collect and customize metrics.
Collecting Metrics for TCP Services
This task shows you how to configure Istio to collect metrics for TCP services.
Collecting Metrics for TCP services with Mixer
This task shows you how to configure Istio’s Mixer to collect metrics for TCP services.
This task shows you how to customize the Istio metrics.
Reworking our Addon Integrations
A new way to manage installation of telemetry addons.


