
Grafana support for Prometheus
Grafana supports querying Prometheus.The Grafana data source for Prometheus is included since Grafana 2.5.0 (2015-10-28).
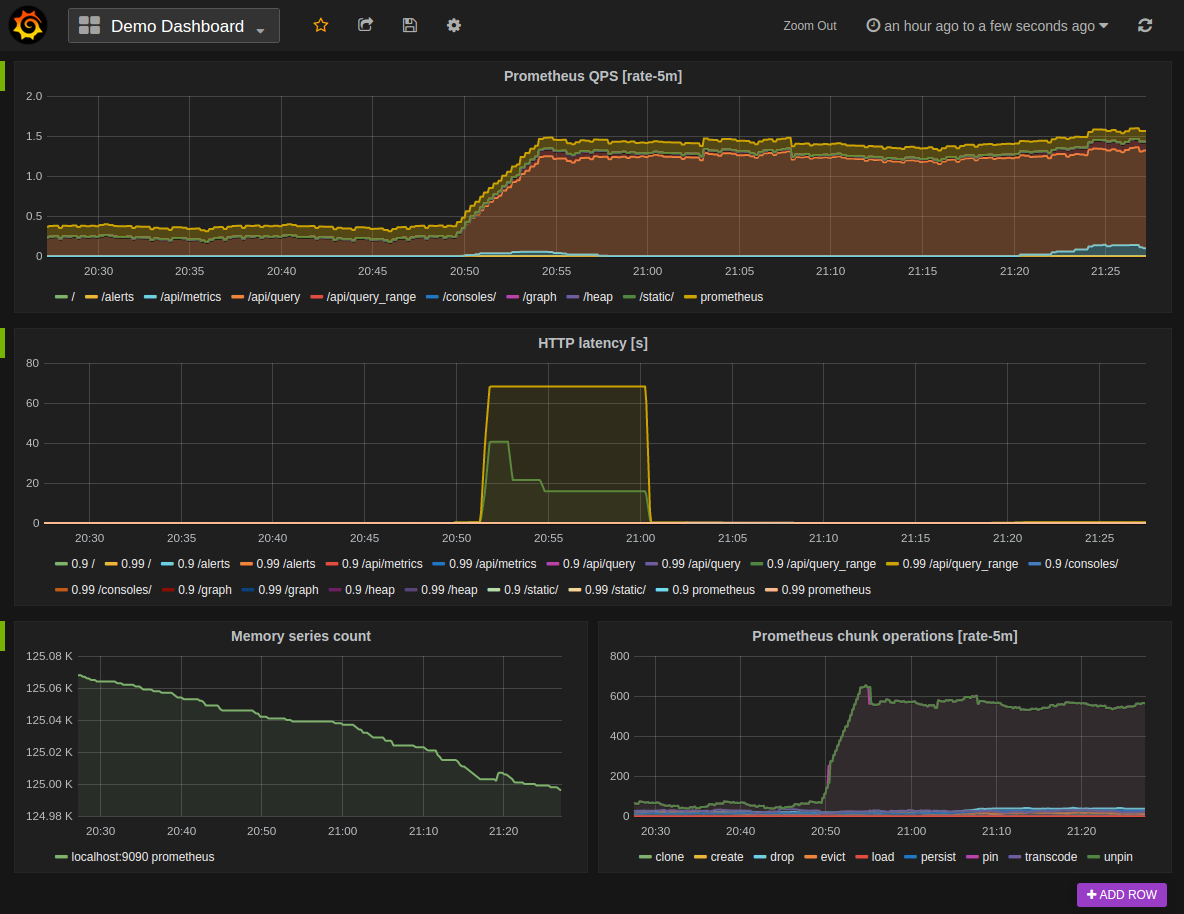
The following shows an example Grafana dashboard which queries Prometheus for data:
Installing
To install Grafana see the official Grafanadocumentation.
Using
By default, Grafana will be listening onhttp://localhost:3000. The default login is "admin" /"admin".
Creating a Prometheus data source
To create a Prometheus data source:
- Click on the Grafana logo to open the sidebar menu.
- Click on "Data Sources" in the sidebar.
- Click on "Add New".
- Select "Prometheus" as the type.
- Set the appropriate Prometheus server URL (for example,
http://localhost:9090/) - Adjust other data source settings as desired (for example, turning the proxy access off).
- Click "Add" to save the new data source.The following shows an example data source configuration:

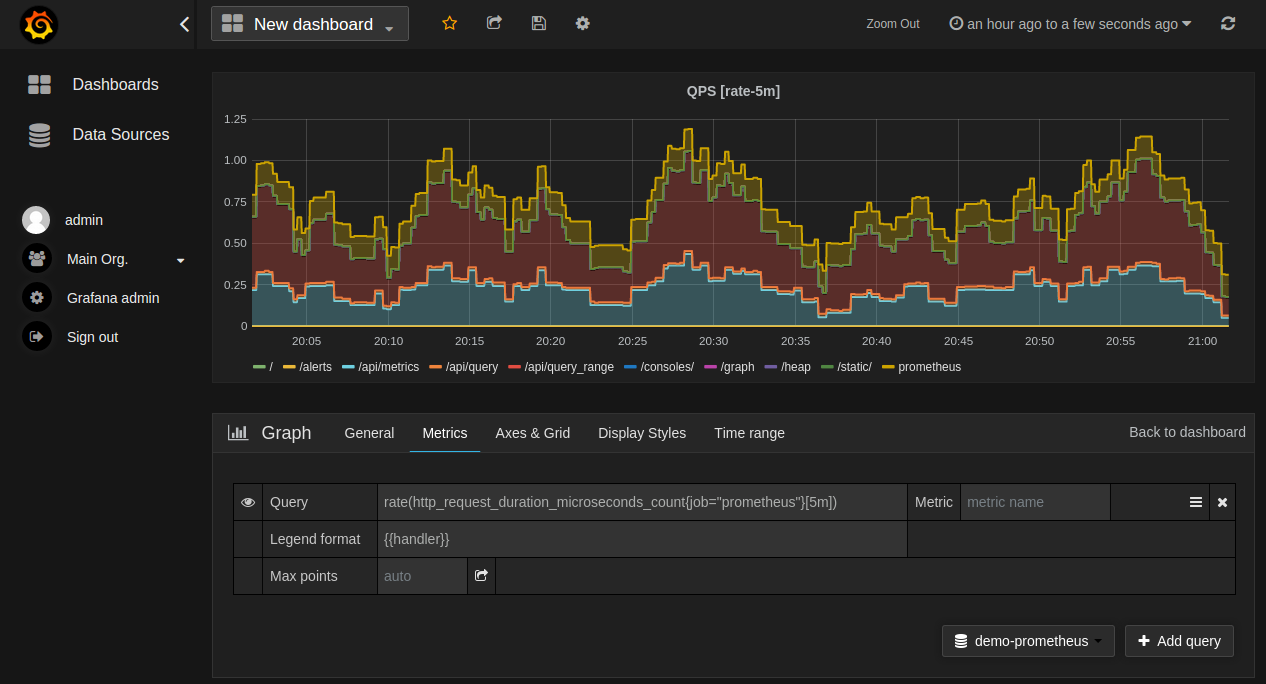
Creating a Prometheus graph
Follow the standard way of adding a new Grafana graph. Then:
- Click the graph title, then click "Edit".
- Under the "Metrics" tab, select your Prometheus data source (bottom right).
- Enter any Prometheus expression into the "Query" field, while using the"Metric" field to lookup metrics via autocompletion.
- To format the legend names of time series, use the "Legend format" input. Forexample, to show only the
methodandstatuslabels of a returned queryresult, separated by a dash, you could use the legend format string{{method}} - {{status}}. - Tune other graph settings until you have a working graph.The following shows an example Prometheus graph configuration:

Importing pre-built dashboards from Grafana.com
Grafana.com maintains a collection of shared dashboardswhich can be downloaded and used with standalone instances of Grafana. Usethe Grafana.com "Filter" option to browse dashboards for the "Prometheus"data source only.
You must currently manually edit the downloaded JSON files and correct thedatasource: entries to reflect the Grafana data source name which youchose for your Prometheus server. Use the "Dashboards" → "Home" → "Import"option to import the edited dashboard file into your Grafana install.


