Time Profiling
This section describes how to profile Web pages using Rust and WebAssembly wherethe goal is improving throughput or latency.
⚡ Always make sure you are using an optimized build when profiling!
wasm-pack buildwill build with optimizations by default.
Available Tools
The window.performance.now() Timer
The performance.now() function returns a monotonic timestampmeasured in milliseconds since the Web page was loaded.
Calling performance.now has little overhead, so we can create simple, granularmeasurements from it without distorting the performance of the rest of thesystem and inflicting bias upon our measurements.
We can use it to time various operations, and we can accesswindow.performance.now() via the web-sys crate:
# #![allow(unused_variables)]#fn main() {extern crate web_sys;fn now() -> f64 {web_sys::window().expect("should have a Window").performance().expect("should have a Performance").now()}#}
- The
web_sys::windowfunction - The
web_sys::Window::performancemethod - The
web_sys::Performance::nowmethod
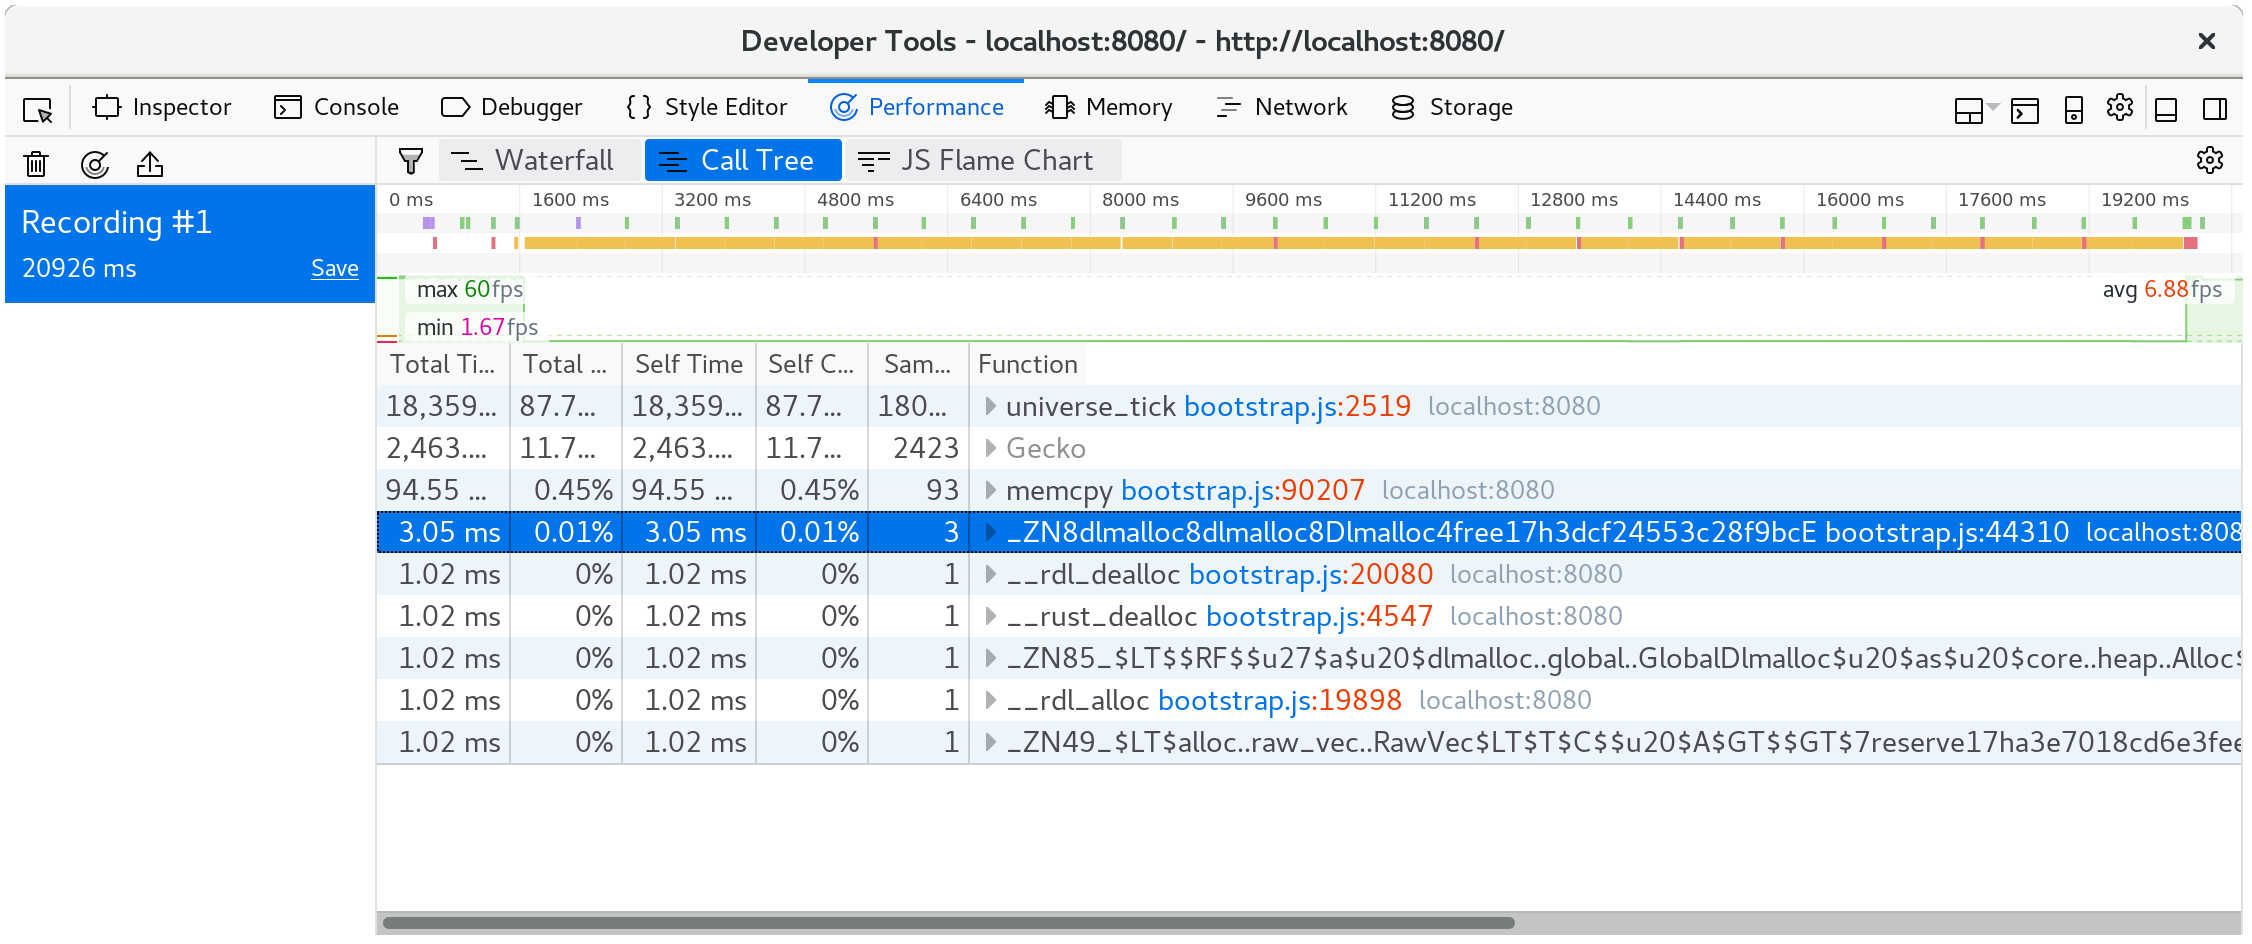
Developer Tools Profilers
All Web browsers' built-in developer tools include a profiler. These profilersdisplay which functions are taking the most time with the usual kinds ofvisualizations like call trees and flame graphs.
If you build with debug symbols so that the "name" custom section isincluded in the wasm binary, then these profilers should display the Rustfunction names instead of something opaque like wasm-function[123].
Note that these profilers won't show inlined functions, and since Rust andLLVM rely on inlining so heavily, the results might still end up a bitperplexing.
Resources
- Firefox Developer Tools — Performance
- Microsoft Edge Developer Tools — Performance
- Chrome DevTools JavaScript Profiler
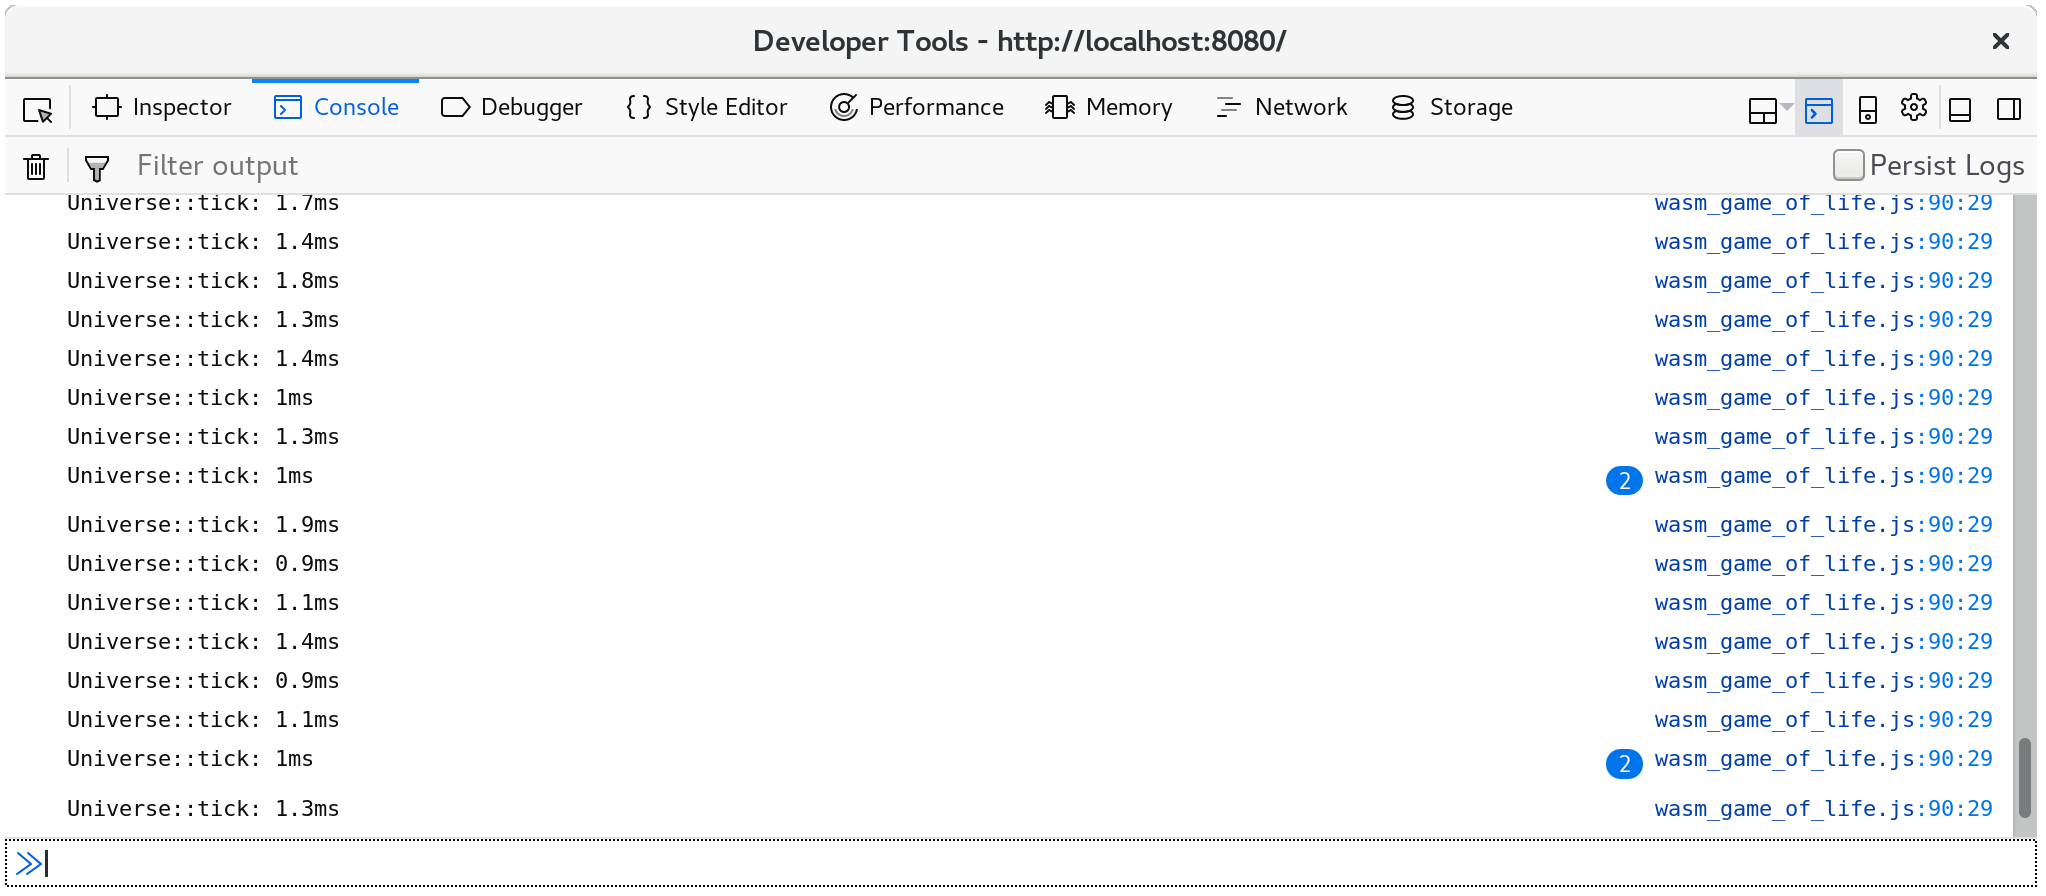
The console.time and console.timeEnd Functions
The console.time and console.timeEnd functions allow you tolog the timing of named operations to the browser's developer tools console. Youcall console.time("some operation") when the operation begins, and callconsole.timeEnd("some operation") when it finishes. The string label namingthe operation is optional.
You can use these functions directly via the web-sys crate:
web_sys::console::time_with_label("some operation")web_sys::console::time_end_with_label("some operation")
Here is a screenshot of console.time logs in the browser's console:
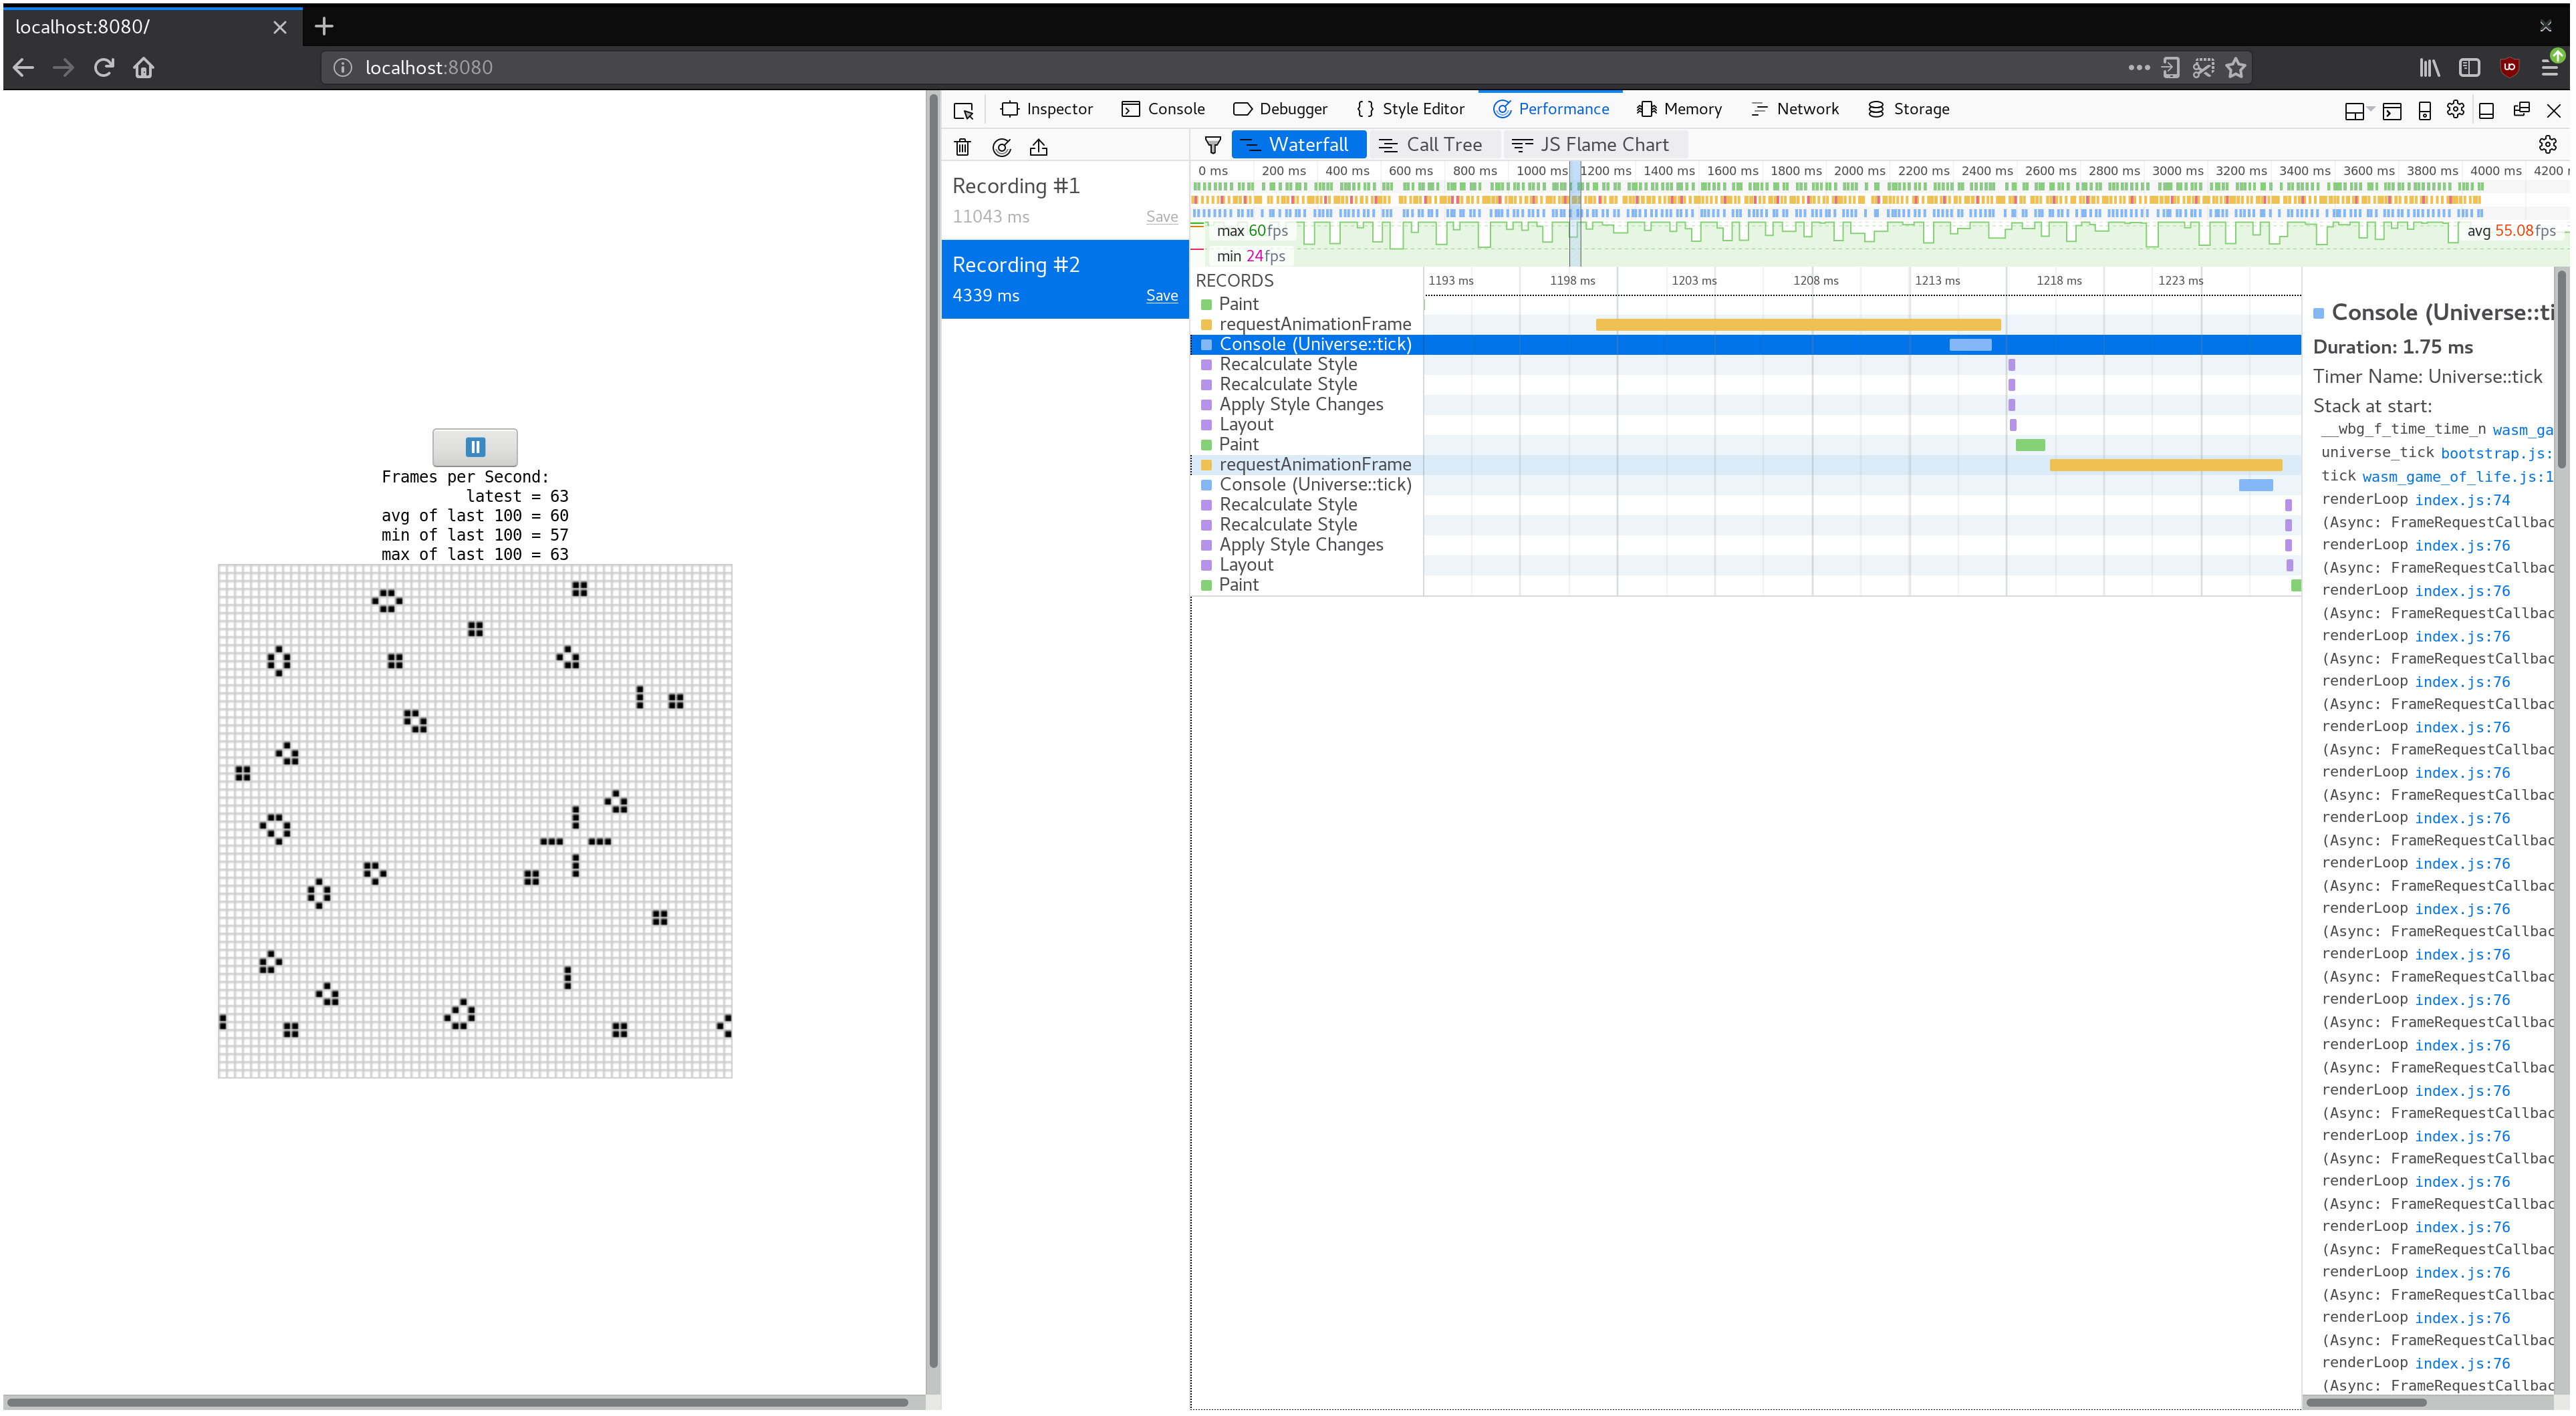
Additionally, console.time and console.timeEnd logs will show up in yourbrowser's profiler's "timeline" or "waterfall" view:
Using #[bench] with Native Code
The same way we can often leverage our operating system's native code debuggingtools by writing #[test]s rather than debugging on the Web, we can leverageour operating system's native code profiling tools by writing #[bench]functions.
Write your benchmarks in the benches subdirectory of your crate. Make surethat your crate-type includes "rlib" or else the bench binaries won't beable to link your main lib.
However! Make sure that you know the bottleneck is in the WebAssembly beforeinvesting much energy in native code profiling! Use your browser's profiler toconfirm this, or else you risk wasting your time optimizing code that isn't hot.