Time Profiling
In this chapter, we will improve the performance of our Game of Lifeimplementation. We will use time profiling to guide our efforts.
Familiarize yourself with the available tools for time profiling Rust andWebAssembly code before continuing.
Creating a Frames Per Second Timer with the window.performance.now Function
This FPS timer will be useful as we investigate speeding up our Game of Life'srendering.
We start by adding an fps object to wasm-game-of-life/www/index.js:
const fps = new class {constructor() {this.fps = document.getElementById("fps");this.frames = [];this.lastFrameTimeStamp = performance.now();}render() {// Convert the delta time since the last frame render into a measure// of frames per second.const now = performance.now();const delta = now - this.lastFrameTimeStamp;this.lastFrameTimeStamp = now;const fps = 1 / delta * 1000;// Save only the latest 100 timings.this.frames.push(fps);if (this.frames.length > 100) {this.frames.shift();}// Find the max, min, and mean of our 100 latest timings.let min = Infinity;let max = -Infinity;let sum = 0;for (let i = 0; i < this.frames.length; i++) {sum += this.frames[i];min = Math.min(this.frames[i], min);max = Math.max(this.frames[i], max);}let mean = sum / this.frames.length;// Render the statistics.this.fps.textContent = `Frames per Second:latest = ${Math.round(fps)}avg of last 100 = ${Math.round(mean)}min of last 100 = ${Math.round(min)}max of last 100 = ${Math.round(max)}`.trim();}};
Next we call the fps render function on each iteration of renderLoop:
const renderLoop = () => {fps.render(); //newuniverse.tick();drawGrid();drawCells();animationId = requestAnimationFrame(renderLoop);};
Finally, don't forget to add the fps element towasm-game-of-life/www/index.html, just above the <canvas>:
<div id="fps"></div>
And add CSS to make its formatting nice:
#fps {white-space: pre;font-family: monospace;}
And voila! Refresh http://localhost:8080 and now wehave an FPS counter!
Time Each Universe::tick with console.time and console.timeEnd
To measure how long each invocation of Universe::tick takes, we can useconsole.time and console.timeEnd via the web-sys crate.
First, add web-sys as a dependency to wasm-game-of-life/Cargo.toml:
[dependencies.web-sys]version = "0.3"features = ["console",]
Because there should be a corresponding console.timeEnd invocation for everyconsole.time call, it is convenient to wrap them both up in an RAII type:
# #![allow(unused_variables)]#fn main() {extern crate web_sys;use web_sys::console;pub struct Timer<'a> {name: &'a str,}impl<'a> Timer<'a> {pub fn new(name: &'a str) -> Timer<'a> {console::time_with_label(name);Timer { name }}}impl<'a> Drop for Timer<'a> {fn drop(&mut self) {console::time_end_with_label(self.name);}}#}
Then, we can time how long each Universe::tick takes by adding this snippet tothe top of the method:
# #![allow(unused_variables)]#fn main() {let _timer = Timer::new("Universe::tick");#}
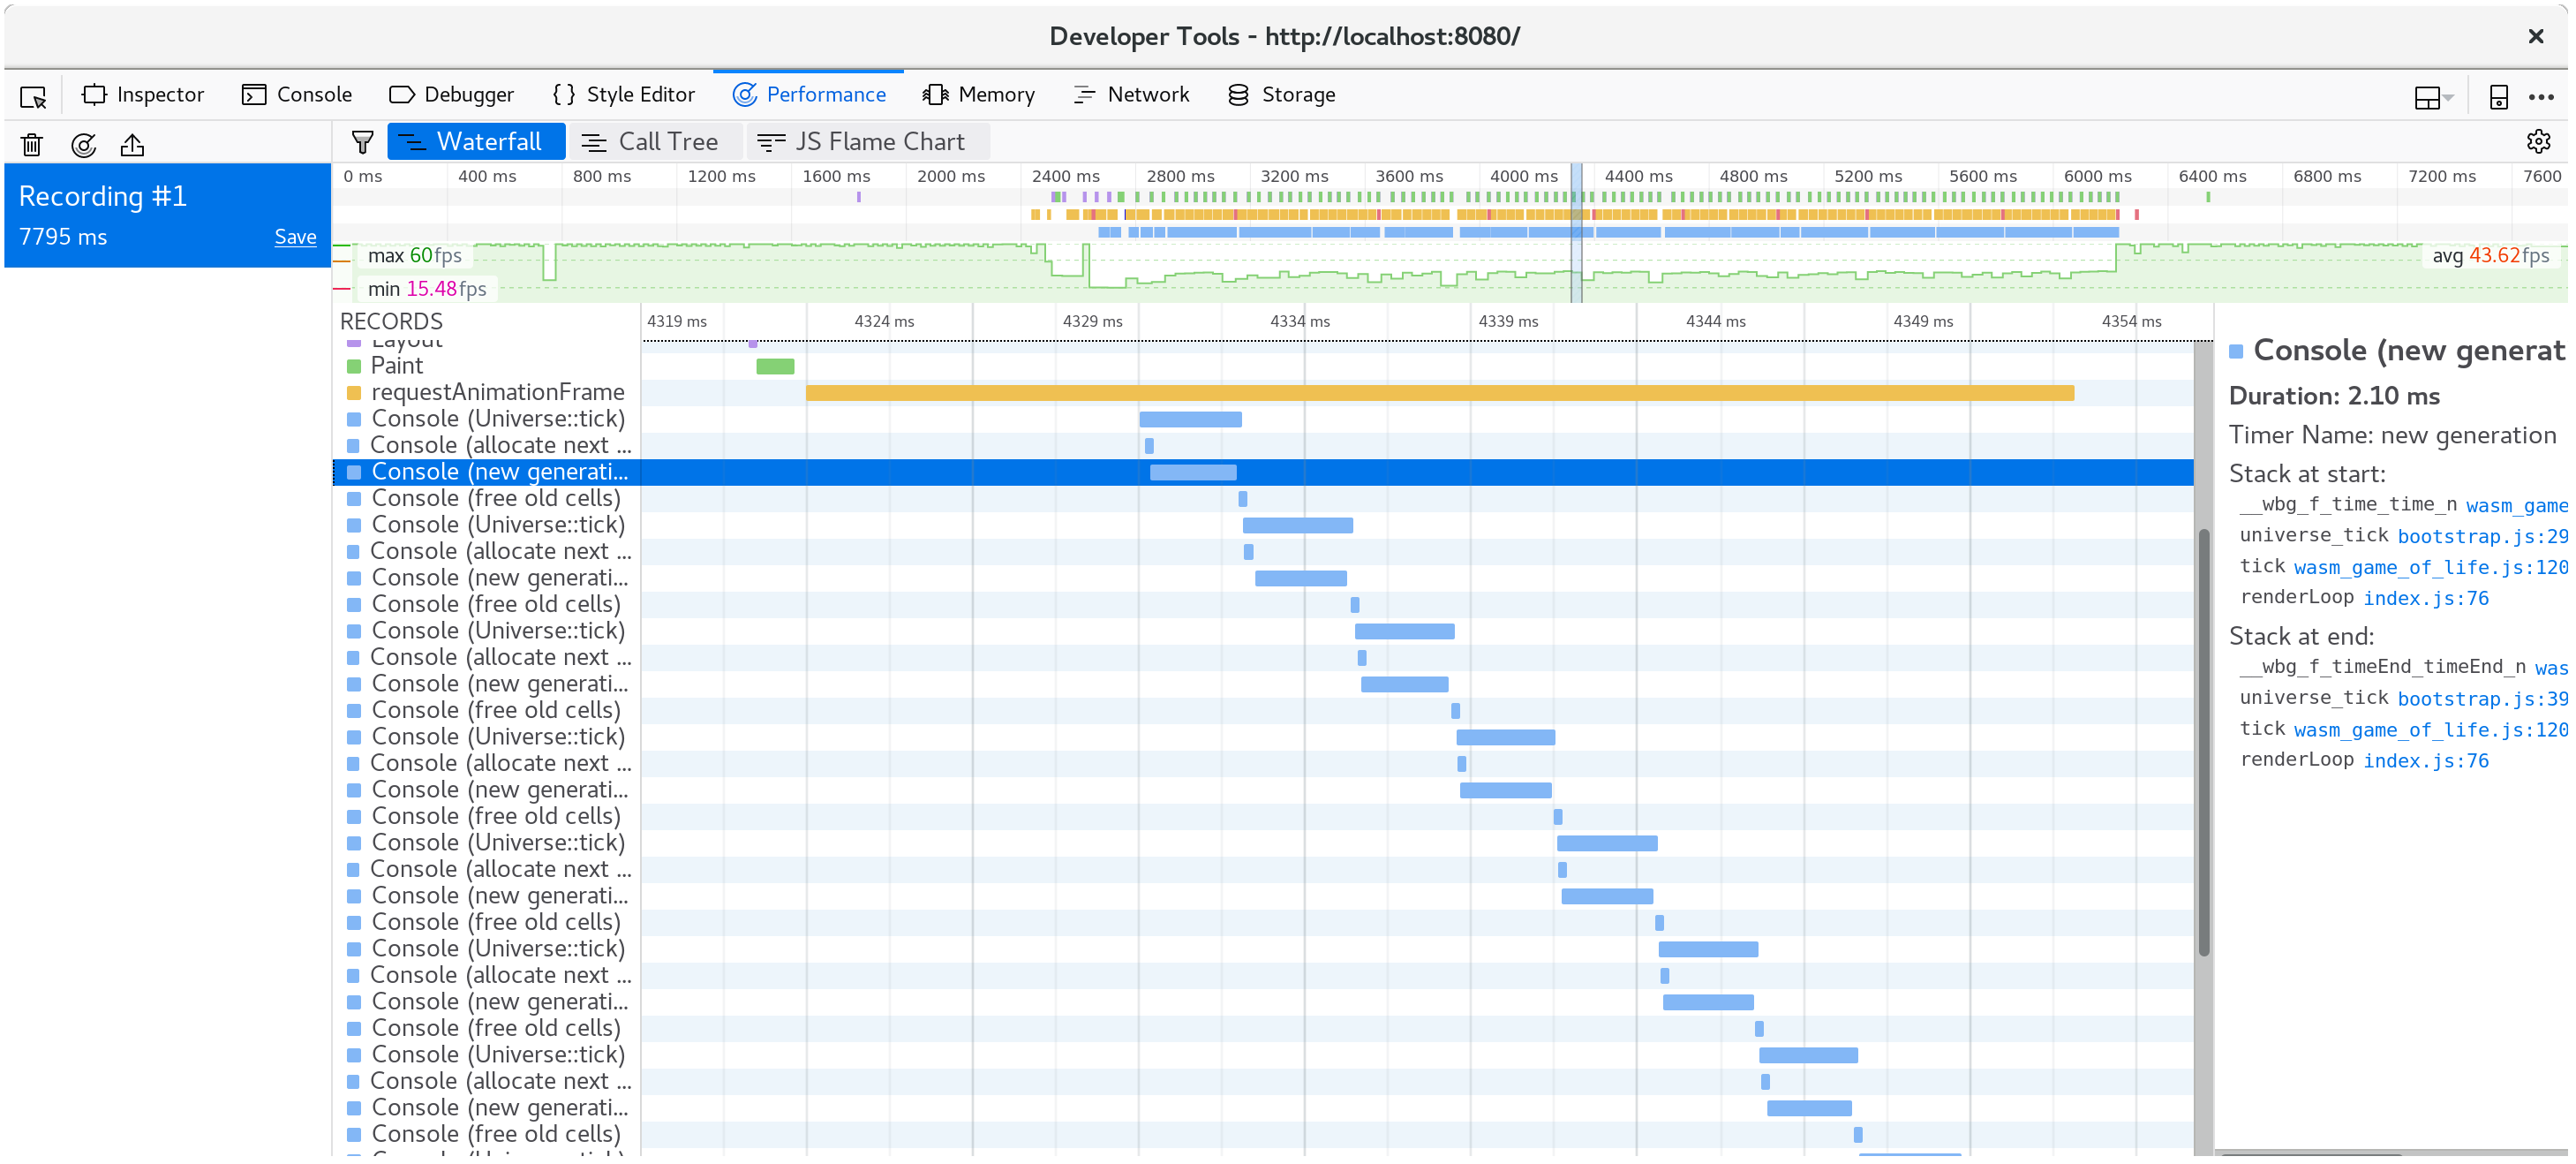
The time of how long each call to Universe::tick took are now logged in theconsole:
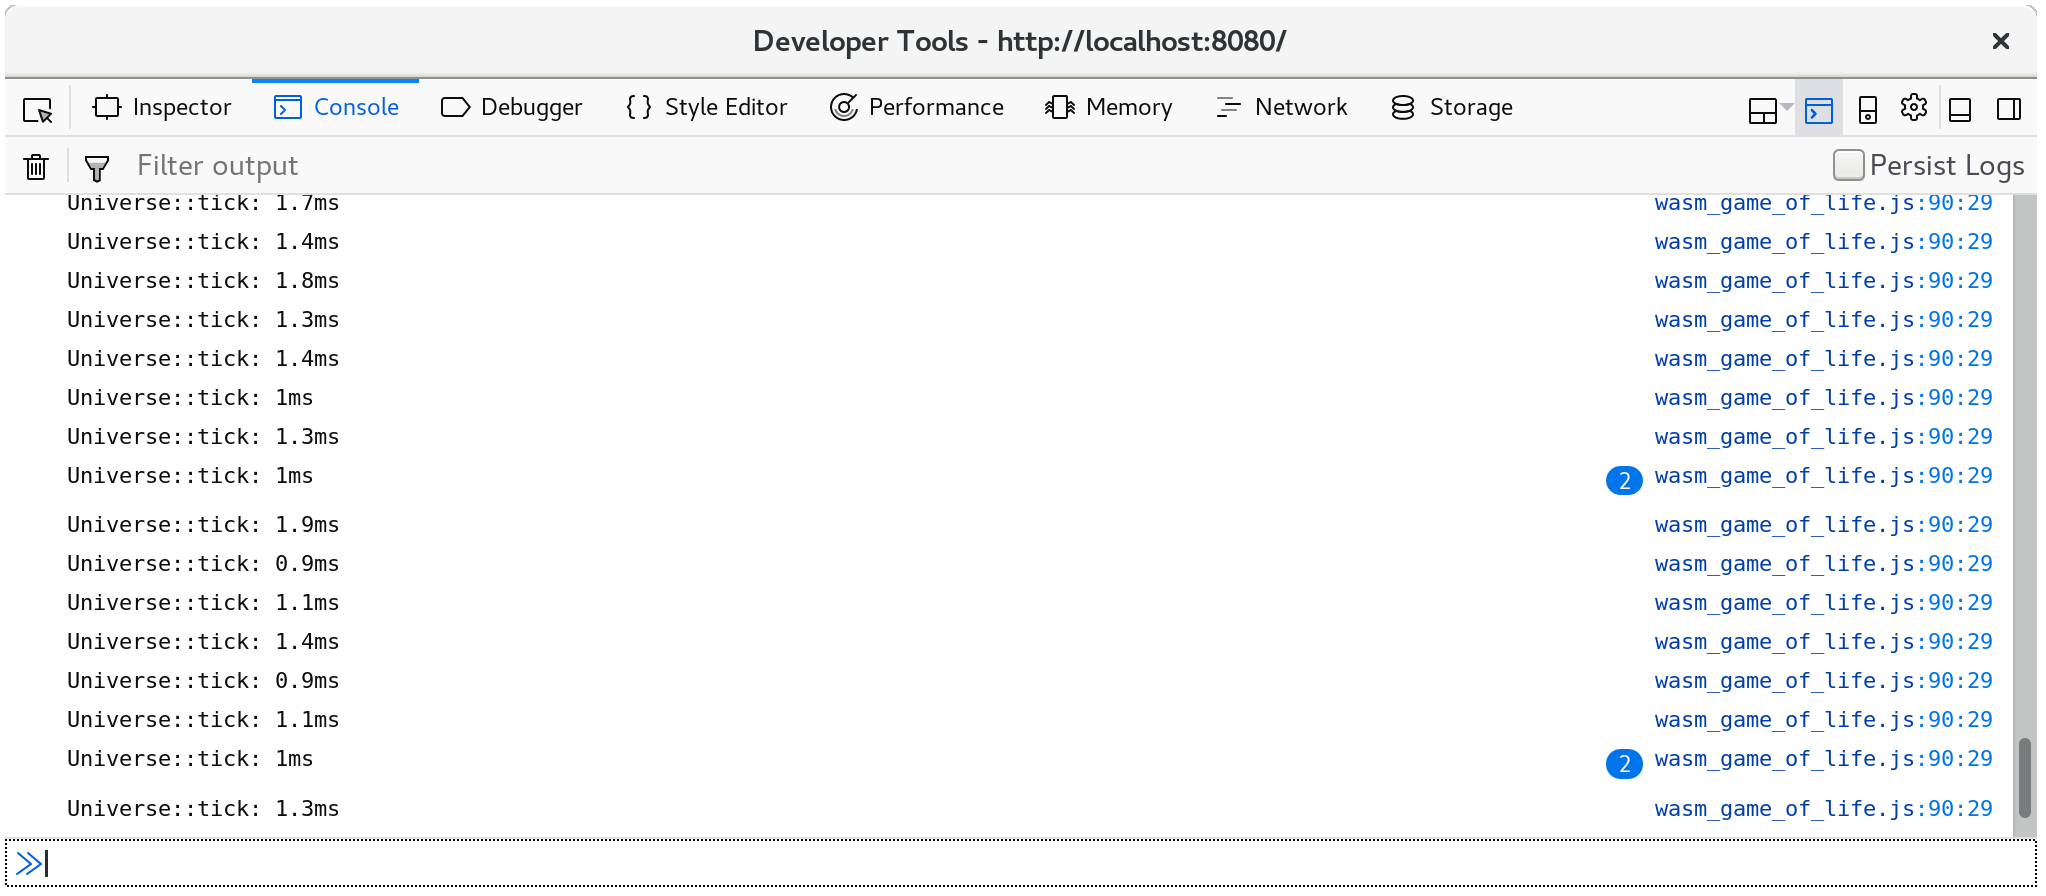
Additionally, console.time and console.timeEnd pairs will show up in yourbrowser's profiler's "timeline" or "waterfall" view:pp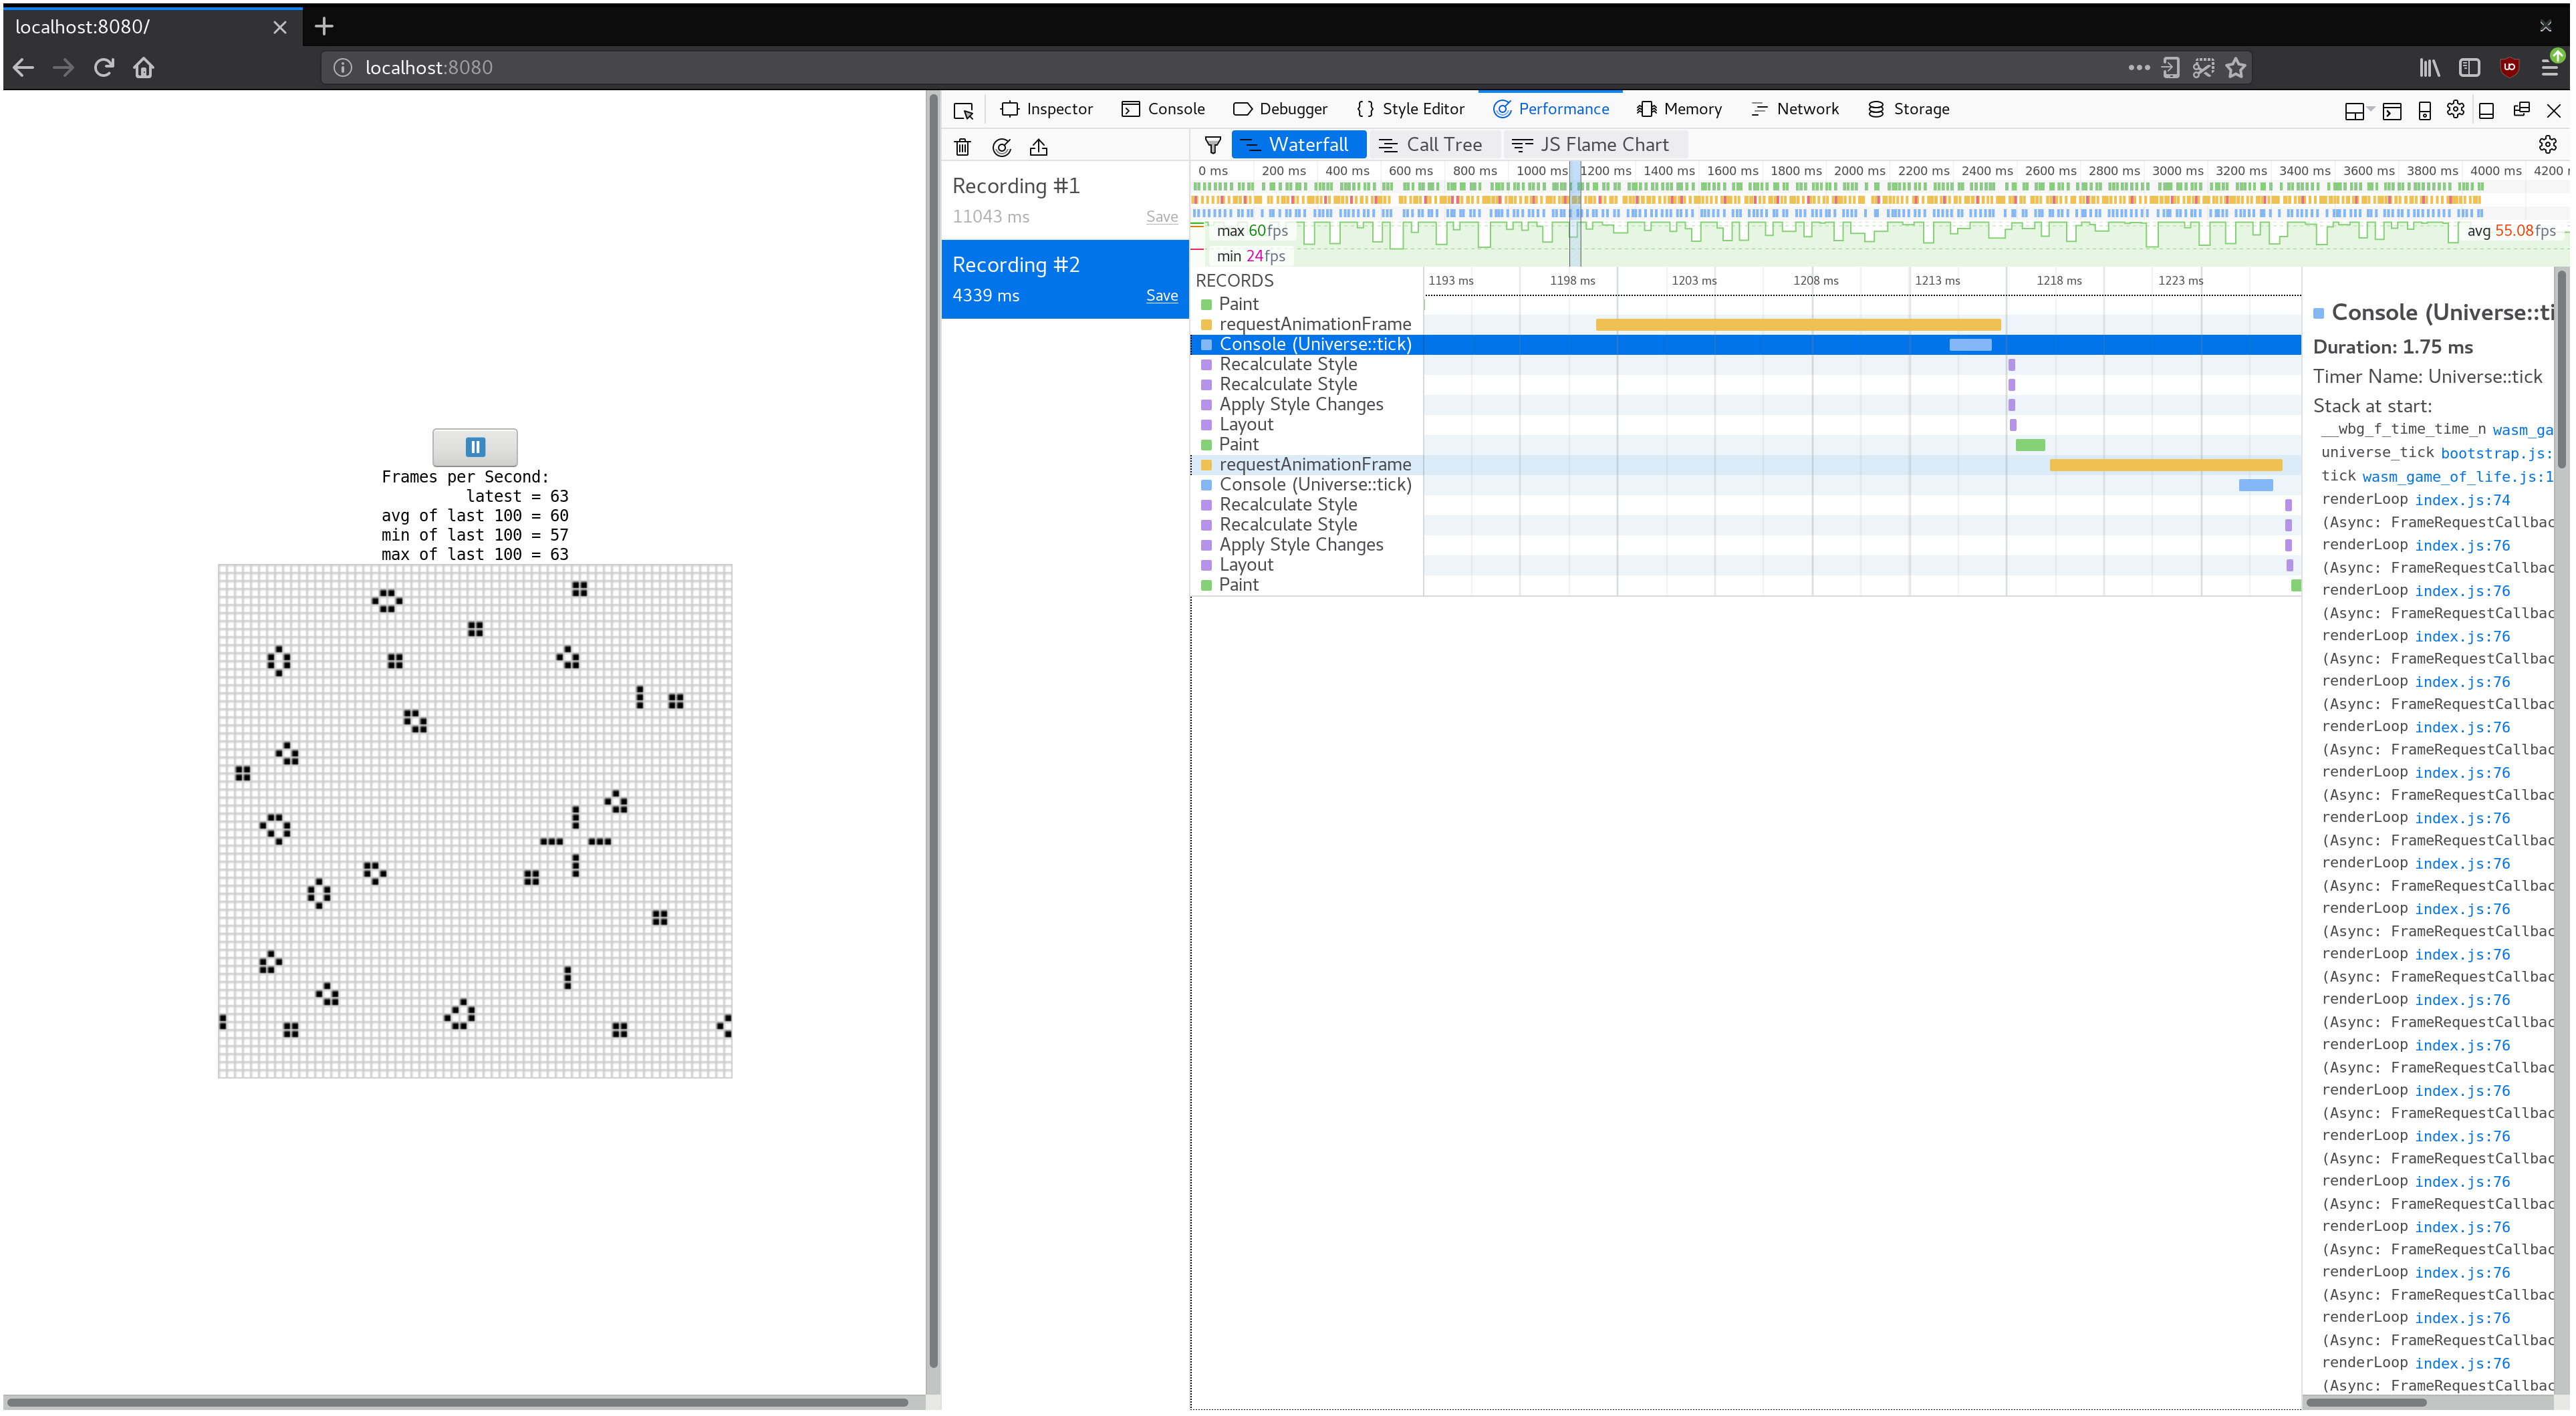
Growing our Game of Life Universe
⚠️ This section utilizes example screenshots from Firefox. While all modern browsers have similar tools, there might be slight nuances to working with different developer tools. The profile information you extract will be essentially the same, but your mileage might vary in terms of the views you see and the naming of different tools.
What happens if we make our Game of Life universe larger? Replacing the 64 by 64universe with a 128 by 128 universe (by modifying Universe::new inwasm-game-of-life/src/lib.rs) results in FPS dropping from a smooth 60 to achoppy 40-ish on my machine.
If we record a profile and look at the waterfall view, we see that eachanimation frame is taking over 20 milliseconds. Recall that 60 frames per secondleaves sixteen milliseconds for the whole process of rendering a frame. That'snot just our JavaScript and WebAssembly, but also everything else the browser isdoing, such as painting.
If we look at what happens within a single animation frame, we see that theCanvasRenderingContext2D.fillStyle setter is very expensive!
⚠️ In Firefox, if you see a line that simply says "DOM" instead of the
CanvasRenderingContext2D.fillStylementioned above, you may need to turn on the option for "Show Gecko Platform Data" in your performance developer tools options:
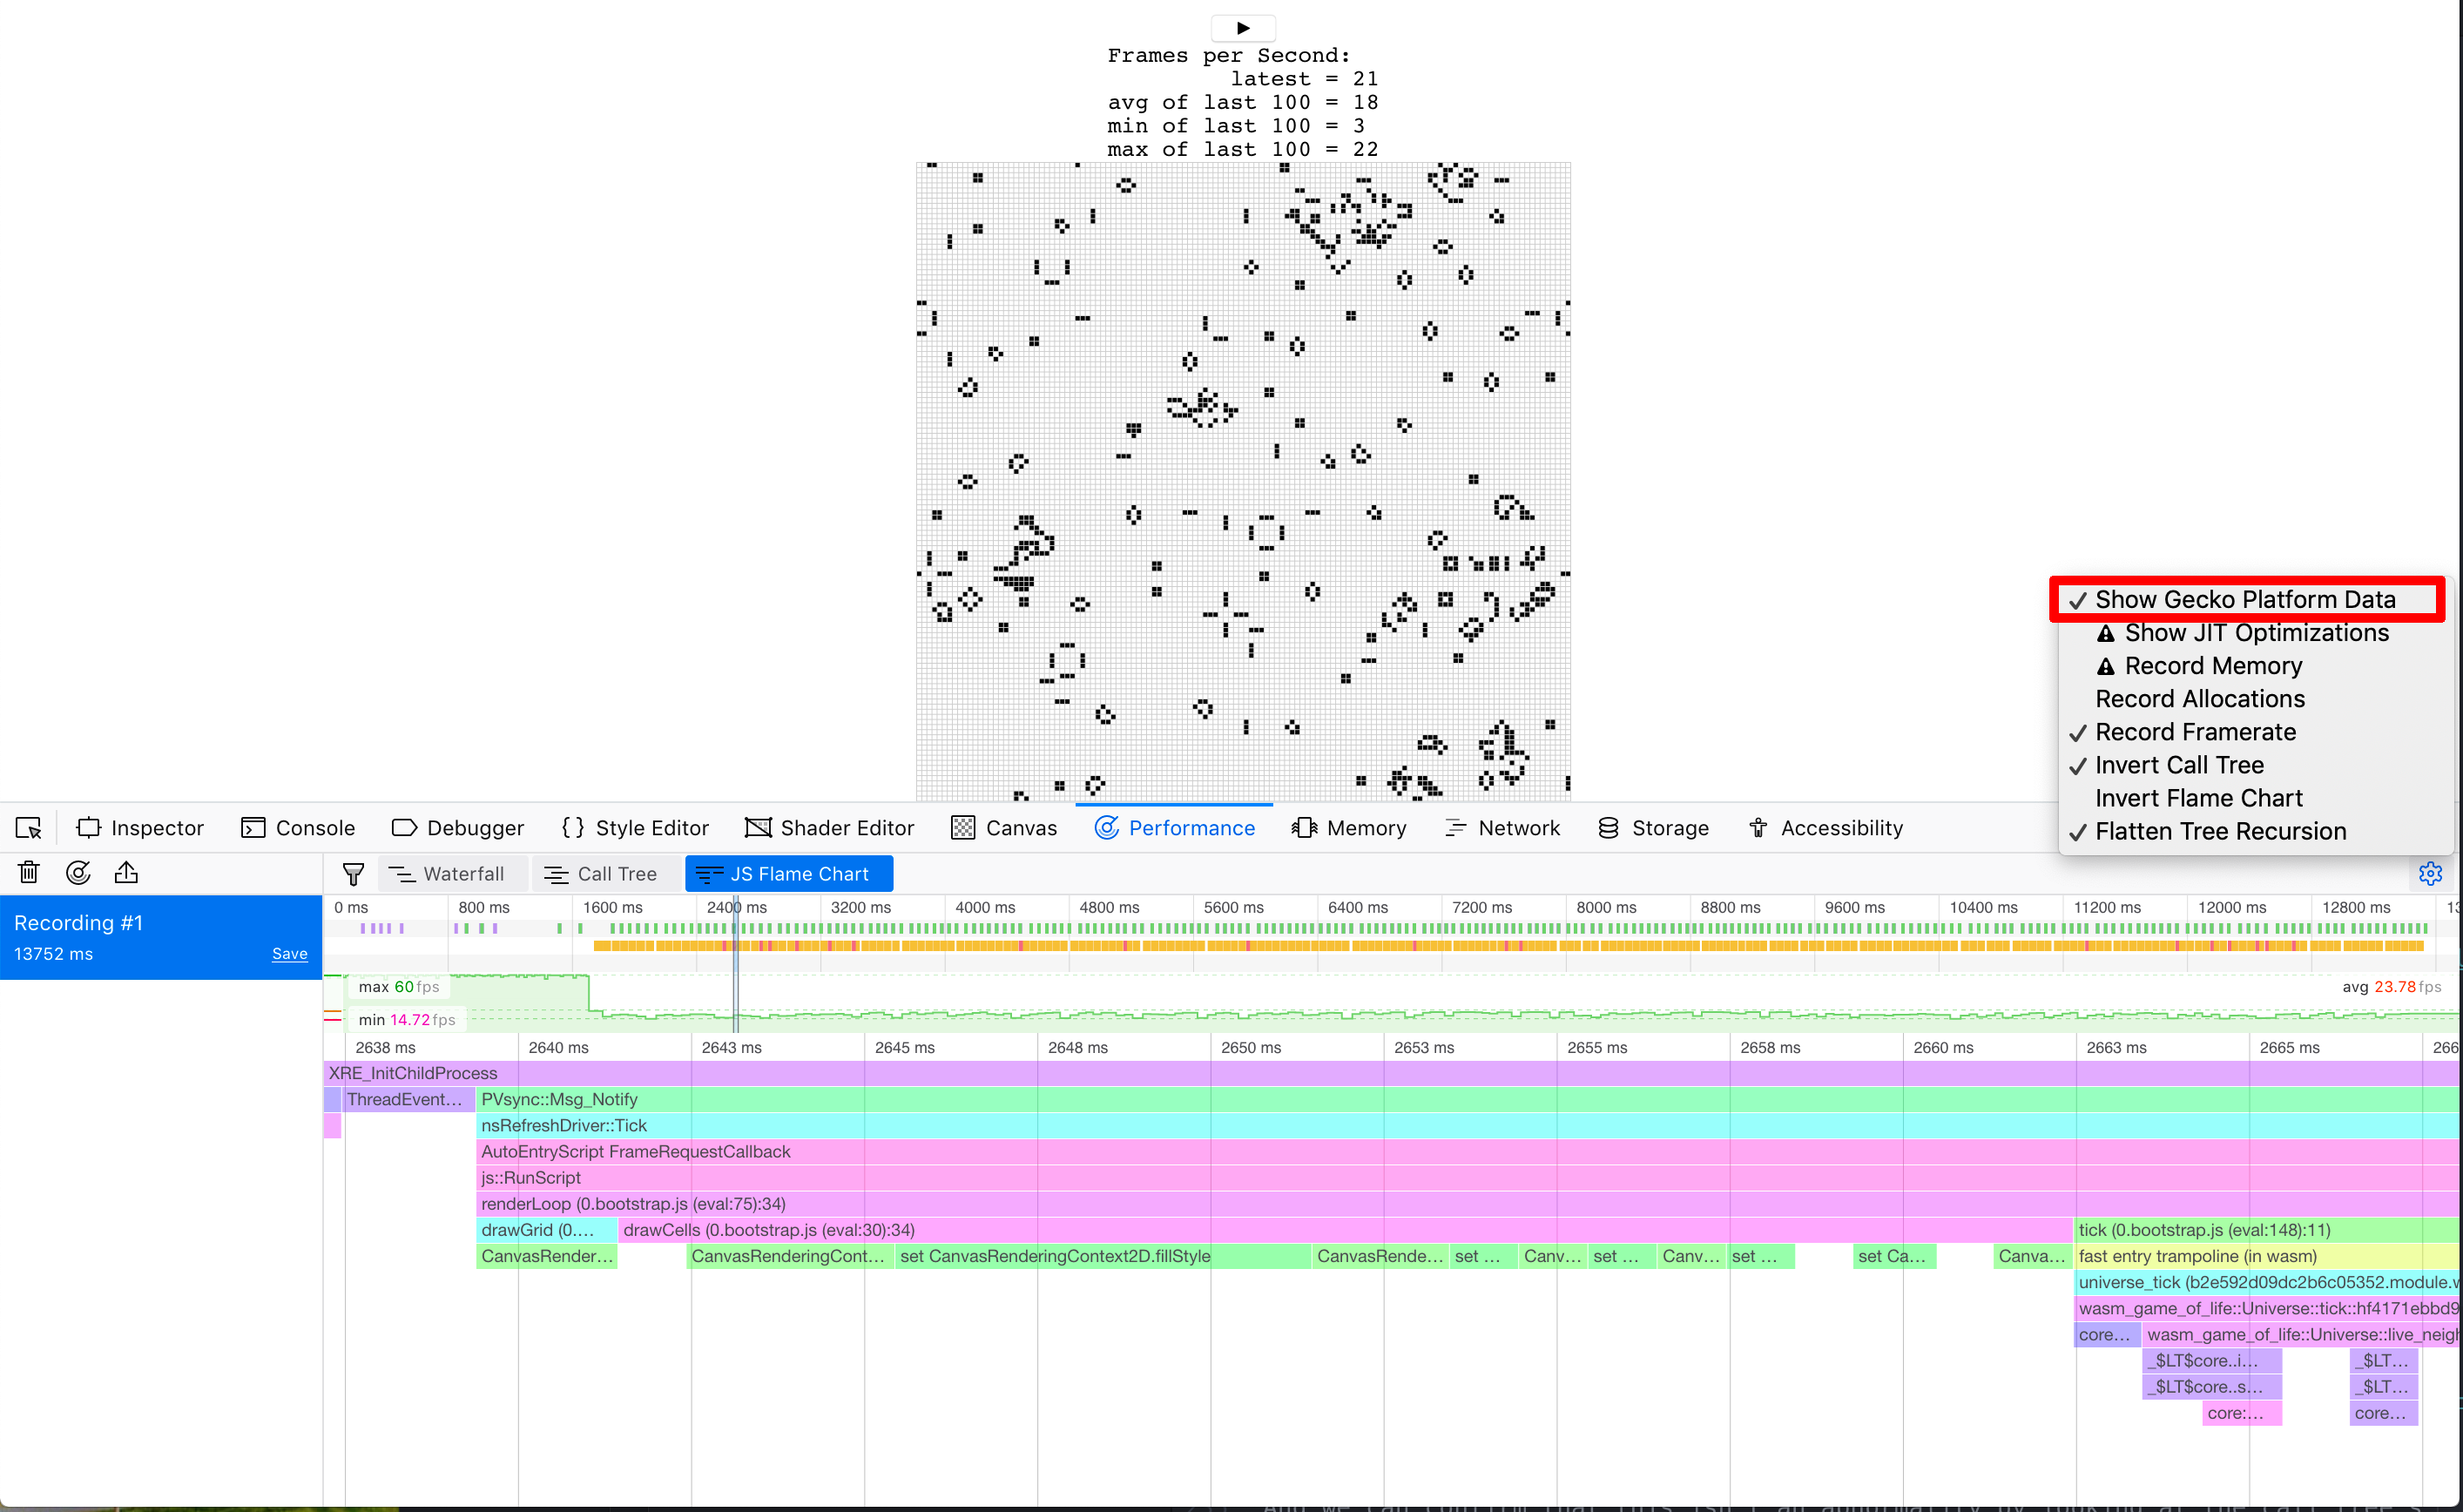
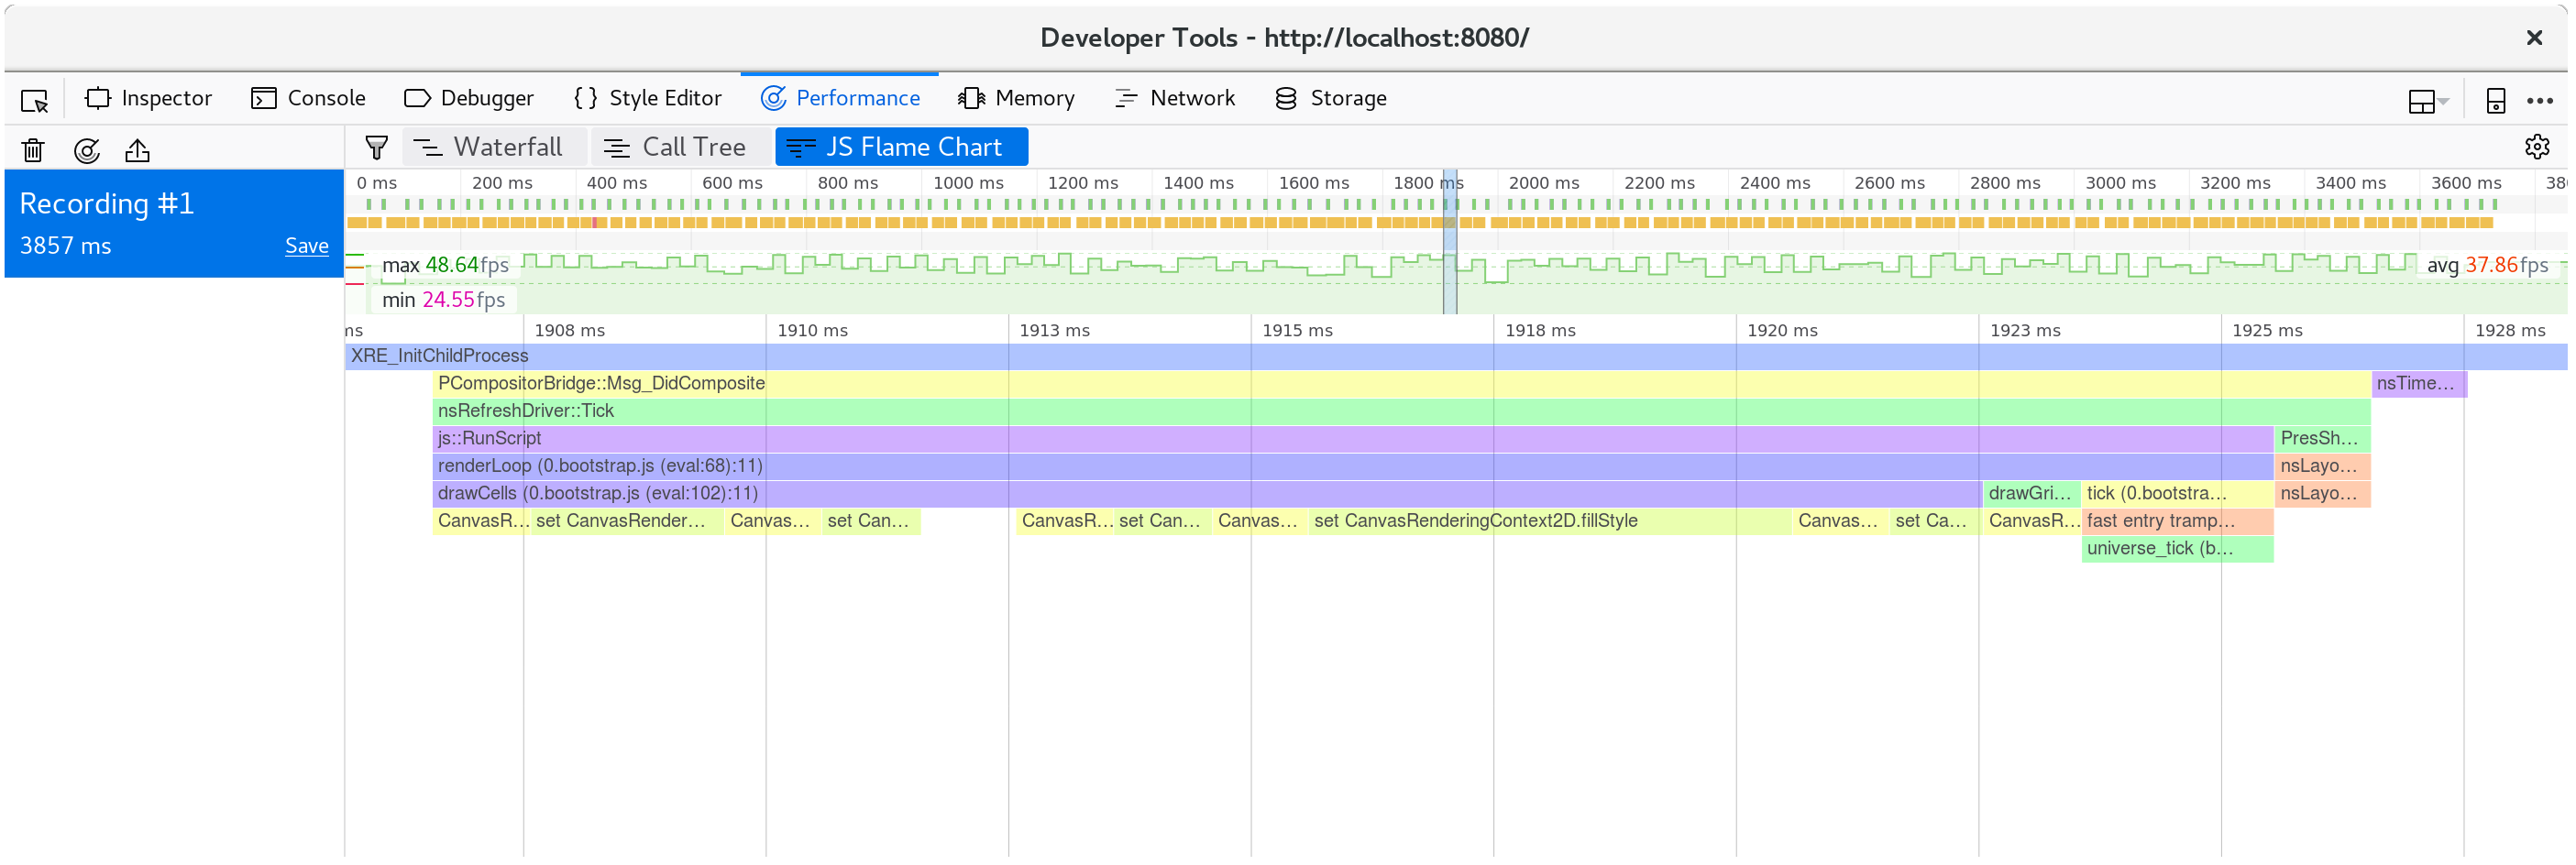
And we can confirm that this isn't an abnormality by looking at the call tree'saggregation of many frames:
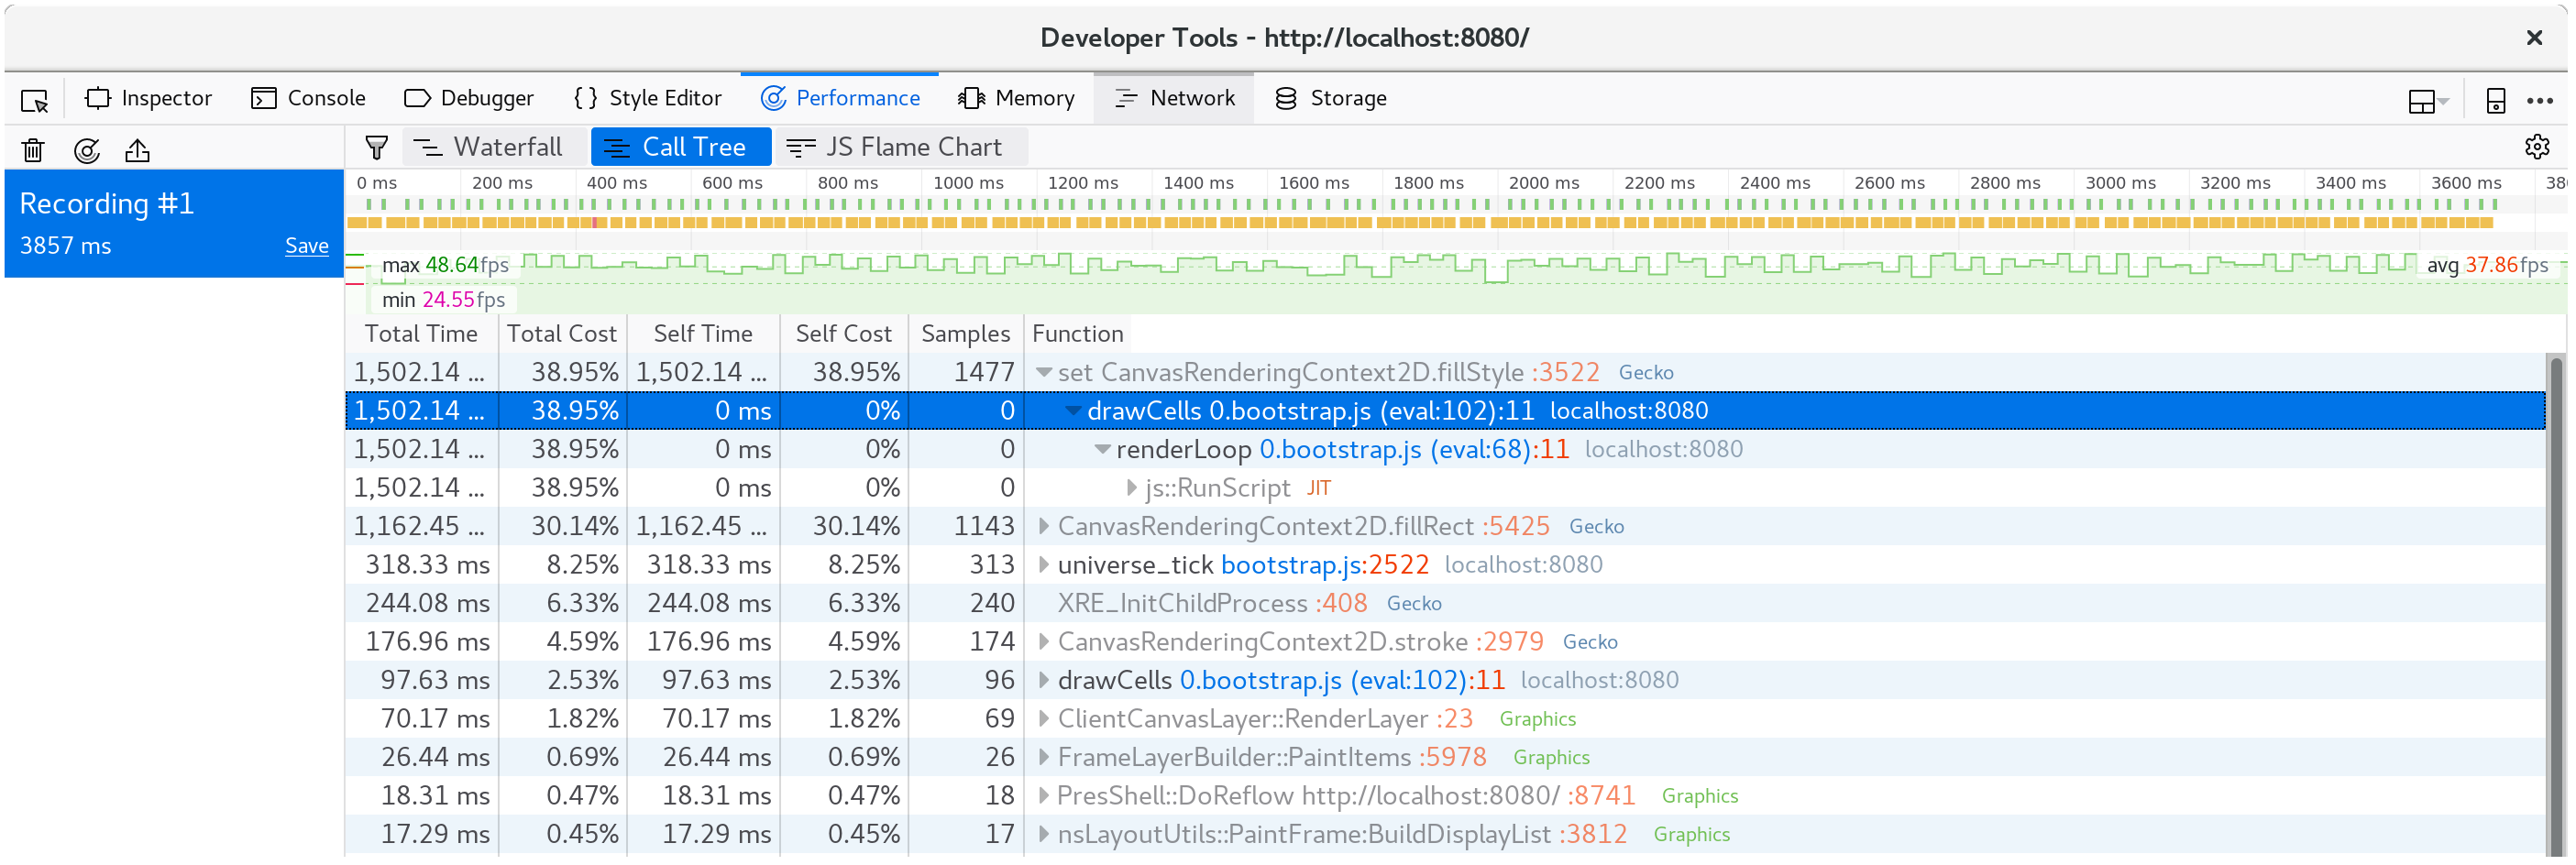
Nearly 40% of our time is spent in this setter!
⚡ We might have expected something in the
tickmethod to be the performance bottleneck, but it wasn't. Always let profiling guide your focus, since time may be spent in places you don't expect it to be.
In the drawCells function in wasm-game-of-life/www/index.js, the fillStyleproperty is set once for every cell in the universe, on every animation frame:
for (let row = 0; row < height; row++) {for (let col = 0; col < width; col++) {const idx = getIndex(row, col);ctx.fillStyle = cells[idx] === DEAD? DEAD_COLOR: ALIVE_COLOR;ctx.fillRect(col * (CELL_SIZE + 1) + 1,row * (CELL_SIZE + 1) + 1,CELL_SIZE,CELL_SIZE);}}
Now that we have discovered that setting fillStyle is so expensive, what canwe do to avoid setting it so often? We need to change fillStyle depending onwhether a cell is alive or dead. If we set fillStyle = ALIVE_COLOR and thendraw every alive cell in one pass, and then set fillStyle = DEAD_COLOR anddraw every dead cell in another pass, then we only end setting fillStyletwice, rather than once for every cell.
// Alive cells.ctx.fillStyle = ALIVE_COLOR;for (let row = 0; row < height; row++) {for (let col = 0; col < width; col++) {const idx = getIndex(row, col);if (cells[idx] !== Cell.Alive) {continue;}ctx.fillRect(col * (CELL_SIZE + 1) + 1,row * (CELL_SIZE + 1) + 1,CELL_SIZE,CELL_SIZE);}}// Dead cells.ctx.fillStyle = DEAD_COLOR;for (let row = 0; row < height; row++) {for (let col = 0; col < width; col++) {const idx = getIndex(row, col);if (cells[idx] !== Cell.Dead) {continue;}ctx.fillRect(col * (CELL_SIZE + 1) + 1,row * (CELL_SIZE + 1) + 1,CELL_SIZE,CELL_SIZE);}}
After saving these changes and refreshinghttp://localhost:8080/, rendering is back to a smooth60 frames per second.
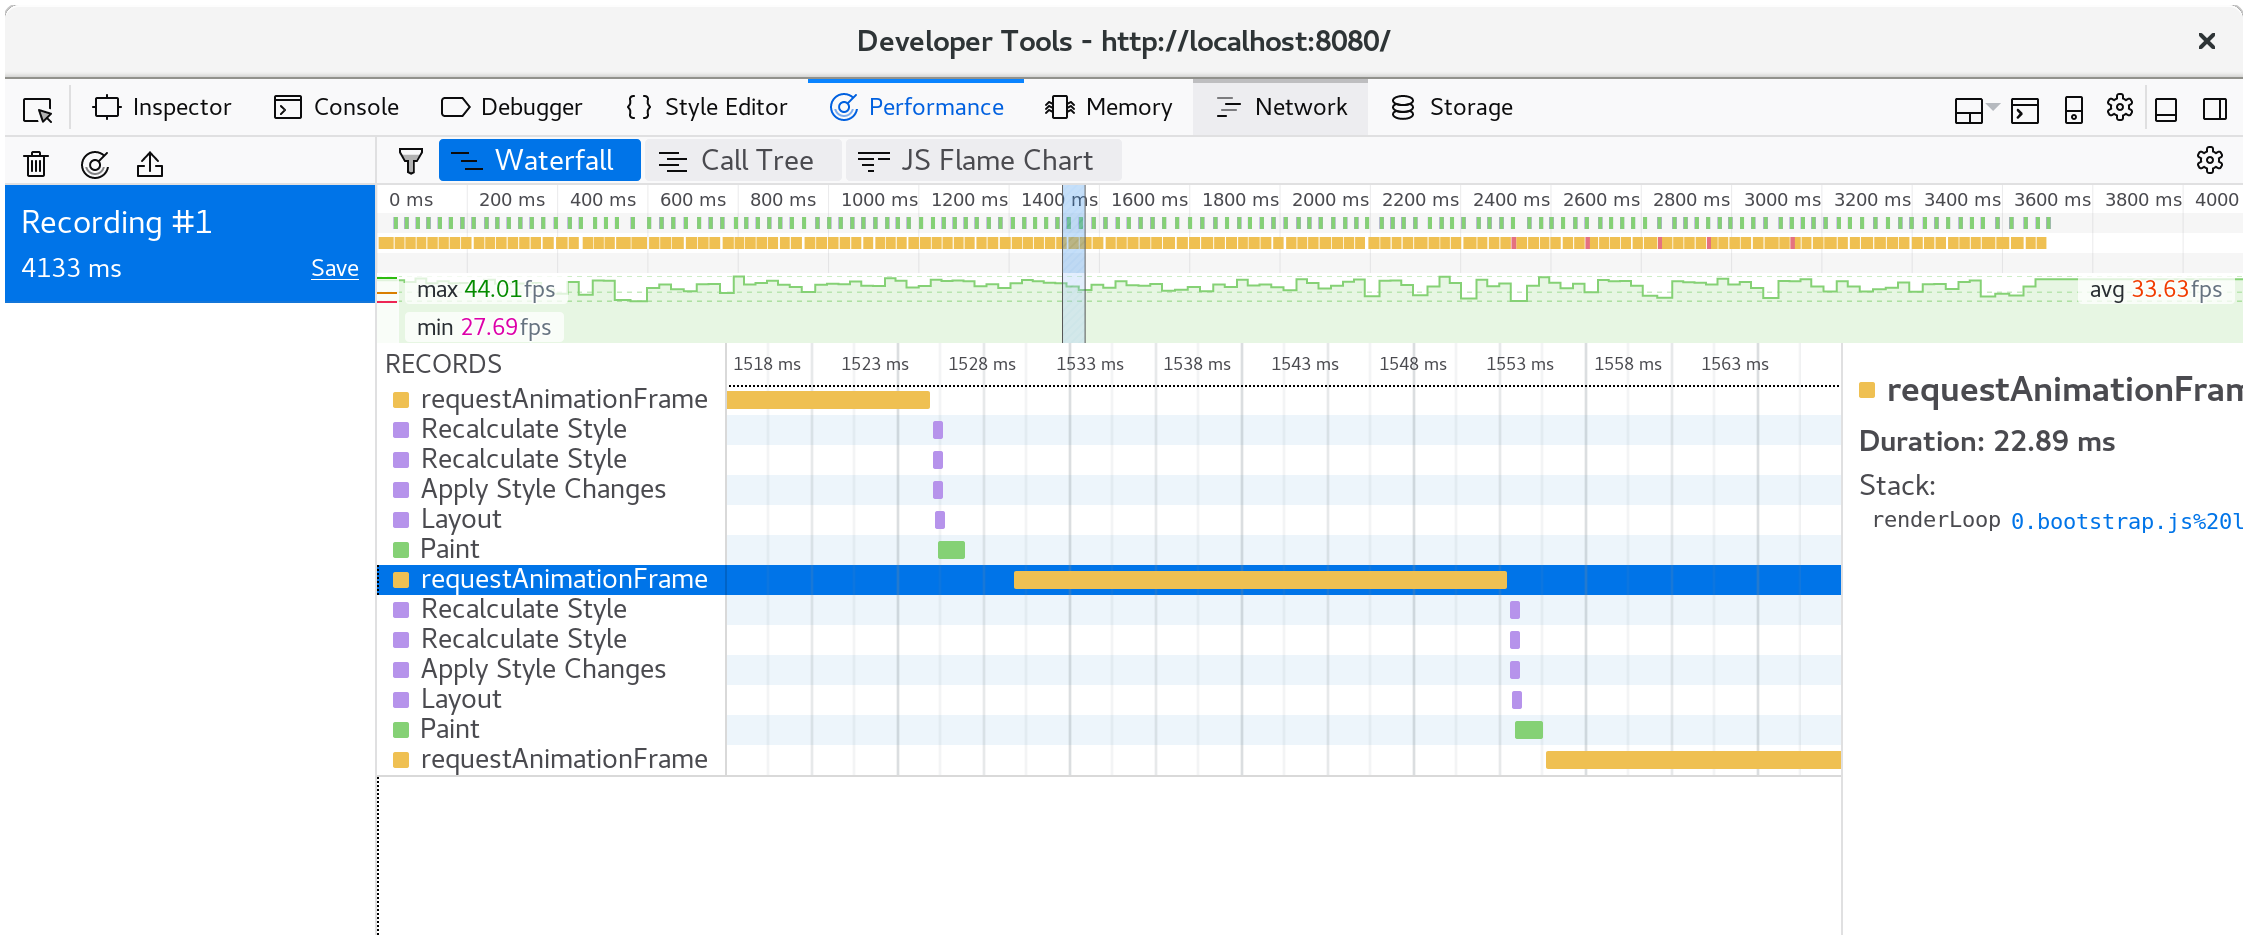
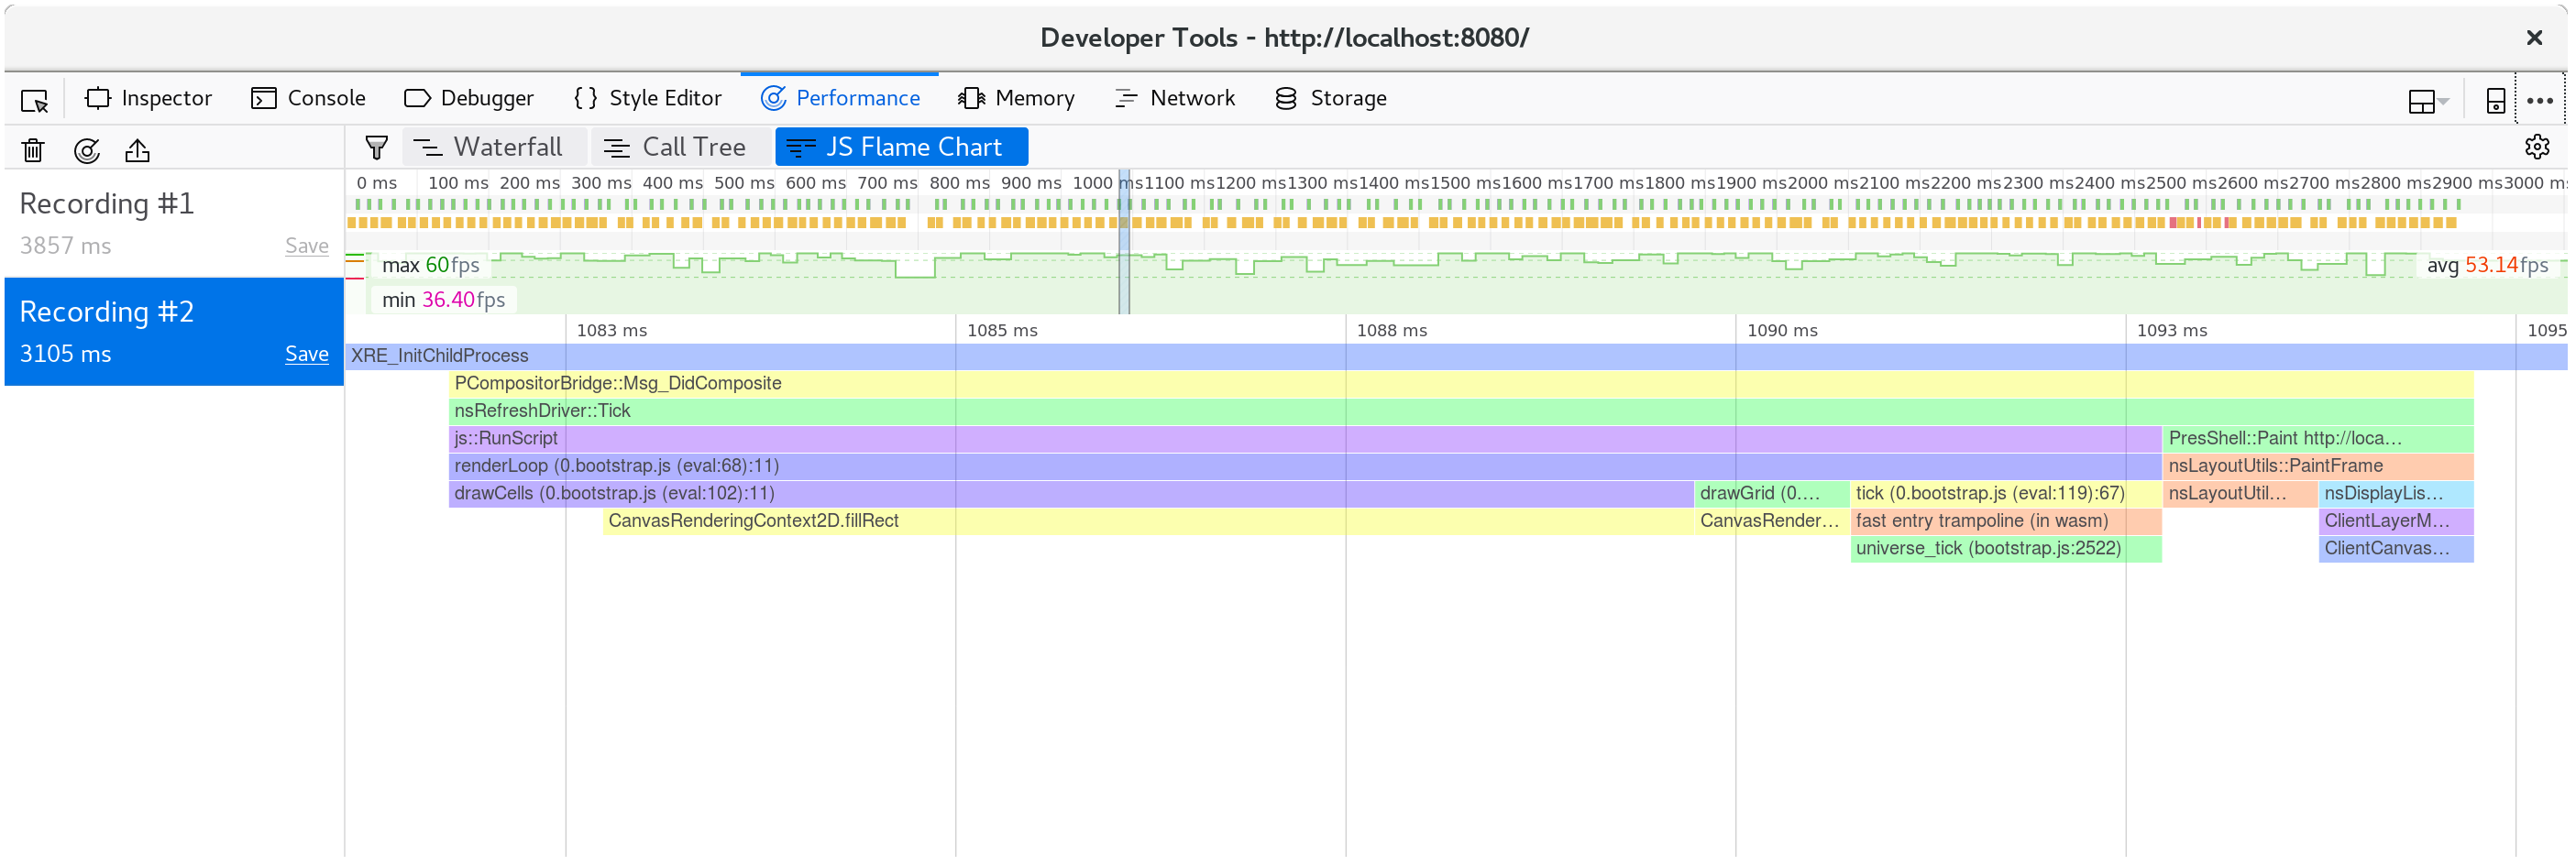
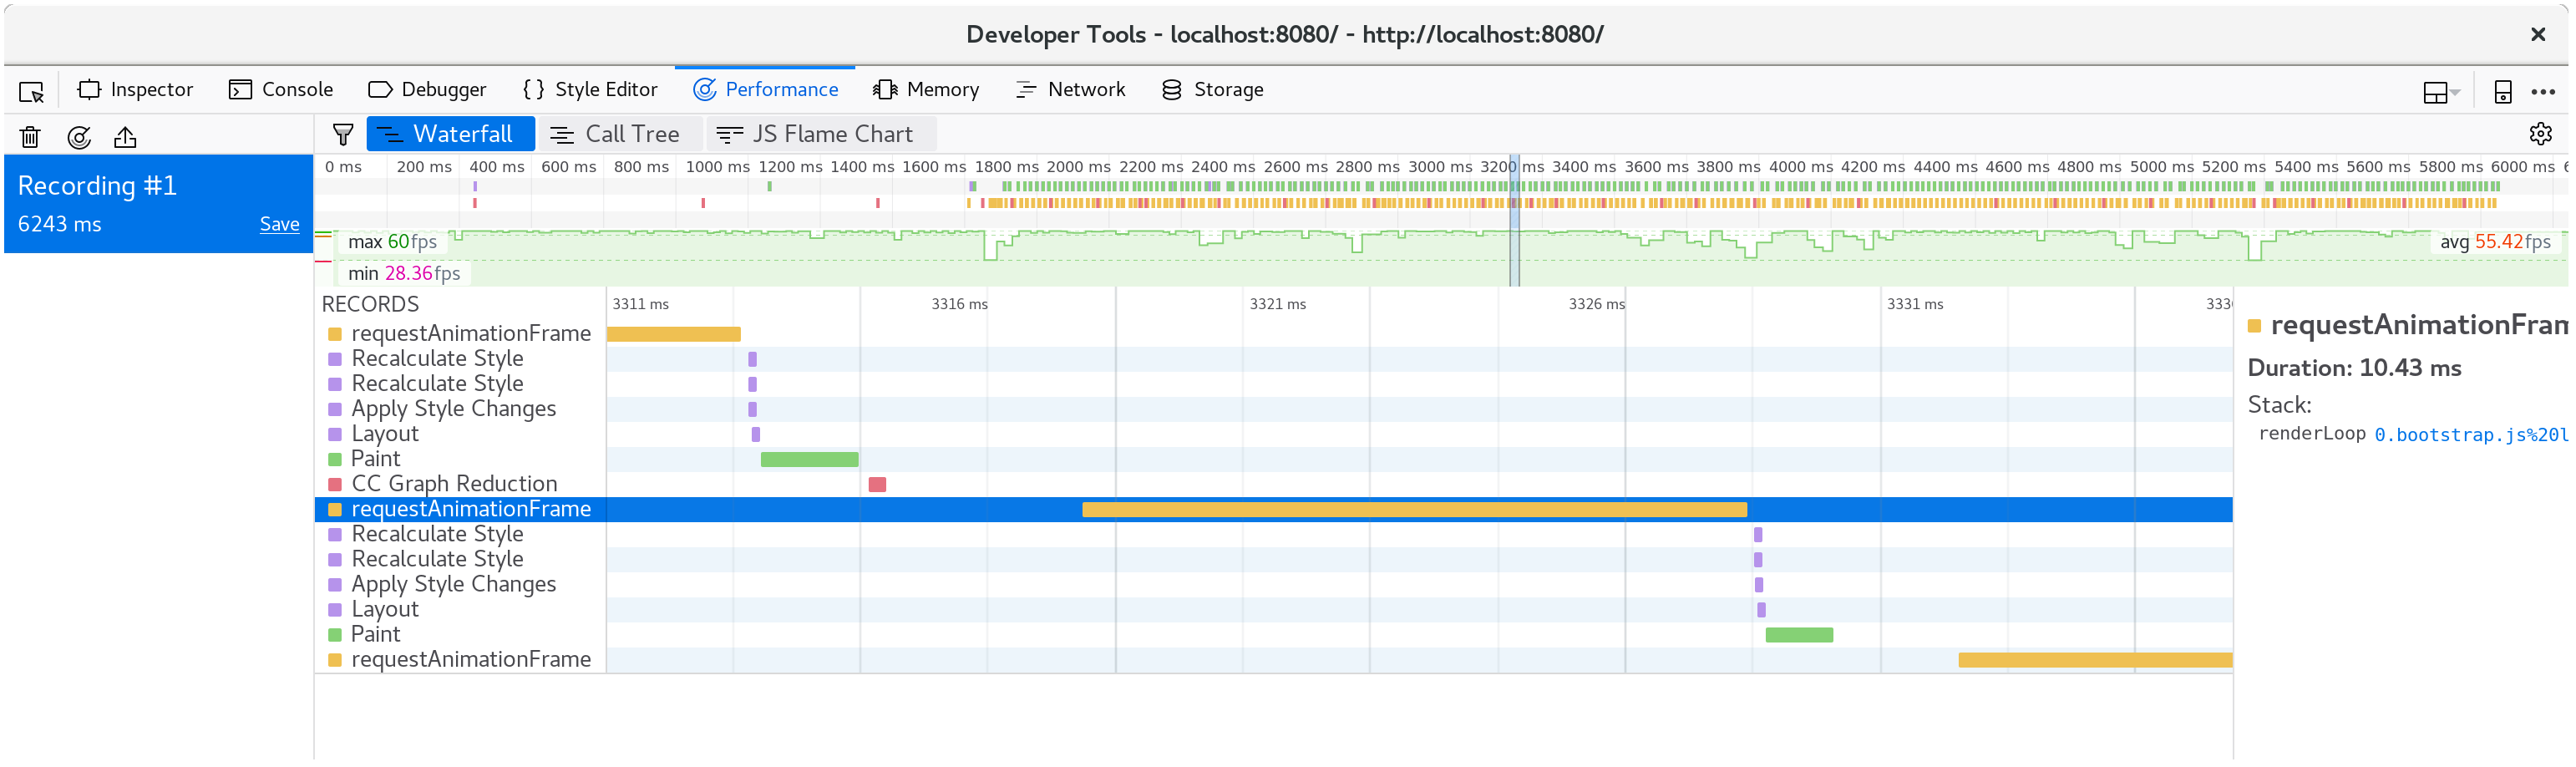
If we take another profile, we can see that only about ten milliseconds arespent in each animation frame now.
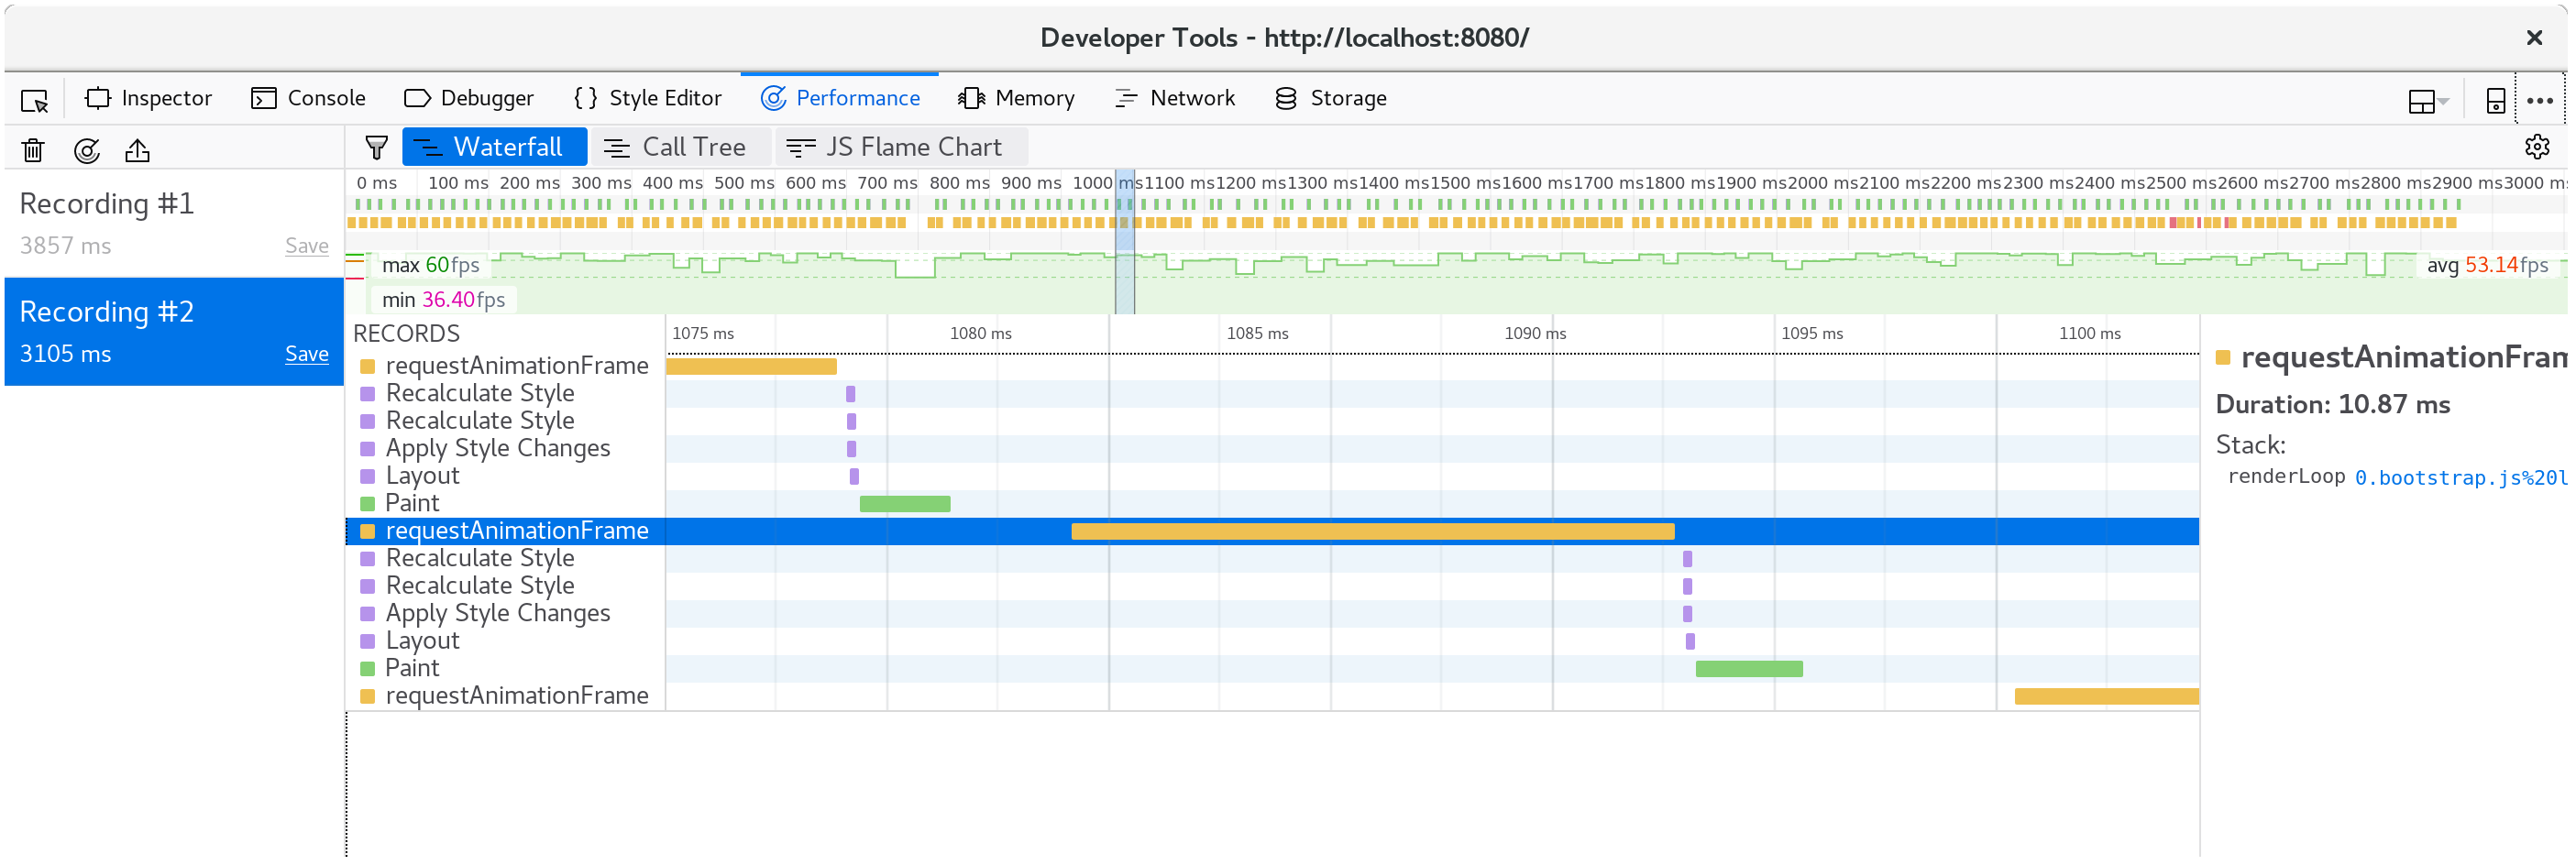
Breaking down a single frame, we see that the fillStyle cost is gone, and mostof our frame's time is spent within fillRect, drawing each cell's rectangle.
Making Time Run Faster
Some folks don't like waiting around, and would prefer if instead of one tick ofthe universe occurred per animation frame, nine ticks did. We can modify therenderLoop function in wasm-game-of-life/www/index.js to do this quiteeasily:
for (let i = 0; i < 9; i++) {universe.tick();}
On my machine, this brings us back down to only 35 frames per second. Nogood. We want that buttery 60!
Now we know that time is being spent in Universe::tick, so let's add someTimers to wrap various bits of it in console.time and console.timeEndcalls, and see where that leads us. My hypothesis is that allocating a newvector of cells and freeing the old vector on every tick is costly, and takingup a significant portion of our time budget.
# #![allow(unused_variables)]#fn main() {pub fn tick(&mut self) {let _timer = Timer::new("Universe::tick");let mut next = {let _timer = Timer::new("allocate next cells");self.cells.clone()};{let _timer = Timer::new("new generation");for row in 0..self.height {for col in 0..self.width {let idx = self.get_index(row, col);let cell = self.cells[idx];let live_neighbors = self.live_neighbor_count(row, col);let next_cell = match (cell, live_neighbors) {// Rule 1: Any live cell with fewer than two live neighbours// dies, as if caused by underpopulation.(Cell::Alive, x) if x < 2 => Cell::Dead,// Rule 2: Any live cell with two or three live neighbours// lives on to the next generation.(Cell::Alive, 2) | (Cell::Alive, 3) => Cell::Alive,// Rule 3: Any live cell with more than three live// neighbours dies, as if by overpopulation.(Cell::Alive, x) if x > 3 => Cell::Dead,// Rule 4: Any dead cell with exactly three live neighbours// becomes a live cell, as if by reproduction.(Cell::Dead, 3) => Cell::Alive,// All other cells remain in the same state.(otherwise, _) => otherwise,};next[idx] = next_cell;}}}let _timer = Timer::new("free old cells");self.cells = next;}#}
Looking at the timings, it is clear that my hypothesis is incorrect: the vastmajority of time is spent actually calculating the next generation ofcells. Allocating and freeing a vector on every tick appears to have negligiblecost, surprisingly. Another reminder to always guide our efforts with profiling!
The next section requires the nightly compiler. It's required because ofthe test feature gatewe're going to use for the benchmarks. Another tool we will install is cargo benchcmp.It's a small utility for comparing micro-benchmarks produced by cargo bench.
Let's write a native code #[bench] doing the same thing that our WebAssemblyis doing, but where we can use more mature profiling tools. Here is the newwasm-game-of-life/benches/bench.rs:
# #![allow(unused_variables)]#![feature(test)]#fn main() {extern crate test;extern crate wasm_game_of_life;#[bench]fn universe_ticks(b: &mut test::Bencher) {let mut universe = wasm_game_of_life::Universe::new();b.iter(|| {universe.tick();});}#}
We also have to comment out all the #[wasm_bindgen] annotations, and the"cdylib" bits from Cargo.toml or else building native code will fail andhave link errors.
With all that in place, we can run cargo bench | tee before.txt to compile and run ourbenchmark! The | tee before.txt part will take the output from cargo bench and put in a filecalled before.txt.
$ cargo bench | tee before.txtFinished release [optimized + debuginfo] target(s) in 0.0 secsRunning target/release/deps/wasm_game_of_life-91574dfbe2b5a124running 0 teststest result: ok. 0 passed; 0 failed; 0 ignored; 0 measured; 0 filtered outRunning target/release/deps/bench-8474091a05cfa2d9running 1 testtest universe_ticks ... bench: 664,421 ns/iter (+/- 51,926)test result: ok. 0 passed; 0 failed; 0 ignored; 1 measured; 0 filtered out
This also tells us where the binary lives, and we can run the benchmarks again,but this time under our operating system's profiler. In my case, I'm runningLinux, so perf is the profiler I'll use:
$ perf record -g target/release/deps/bench-8474091a05cfa2d9 --benchrunning 1 testtest universe_ticks ... bench: 635,061 ns/iter (+/- 38,764)test result: ok. 0 passed; 0 failed; 0 ignored; 1 measured; 0 filtered out[ perf record: Woken up 1 times to write data ][ perf record: Captured and wrote 0.178 MB perf.data (2349 samples) ]
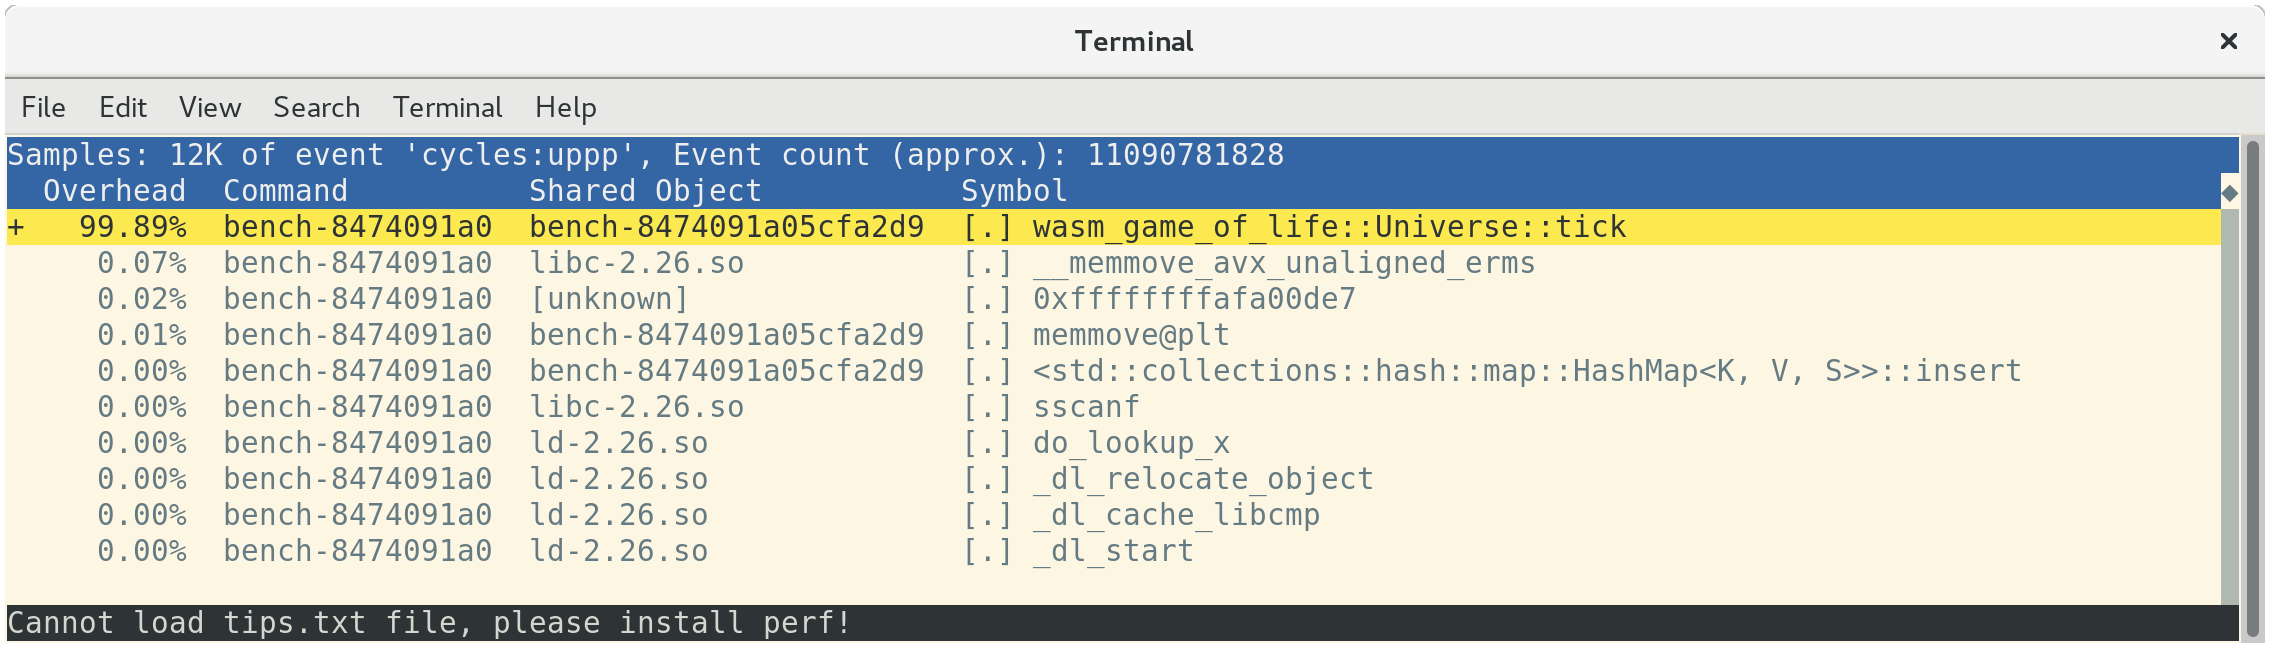
Loading up the profile with perf report shows that all of our time is spent inUniverse::tick, as expected:
perf will annotate which instructions in a function time is being spent at ifyou press a:
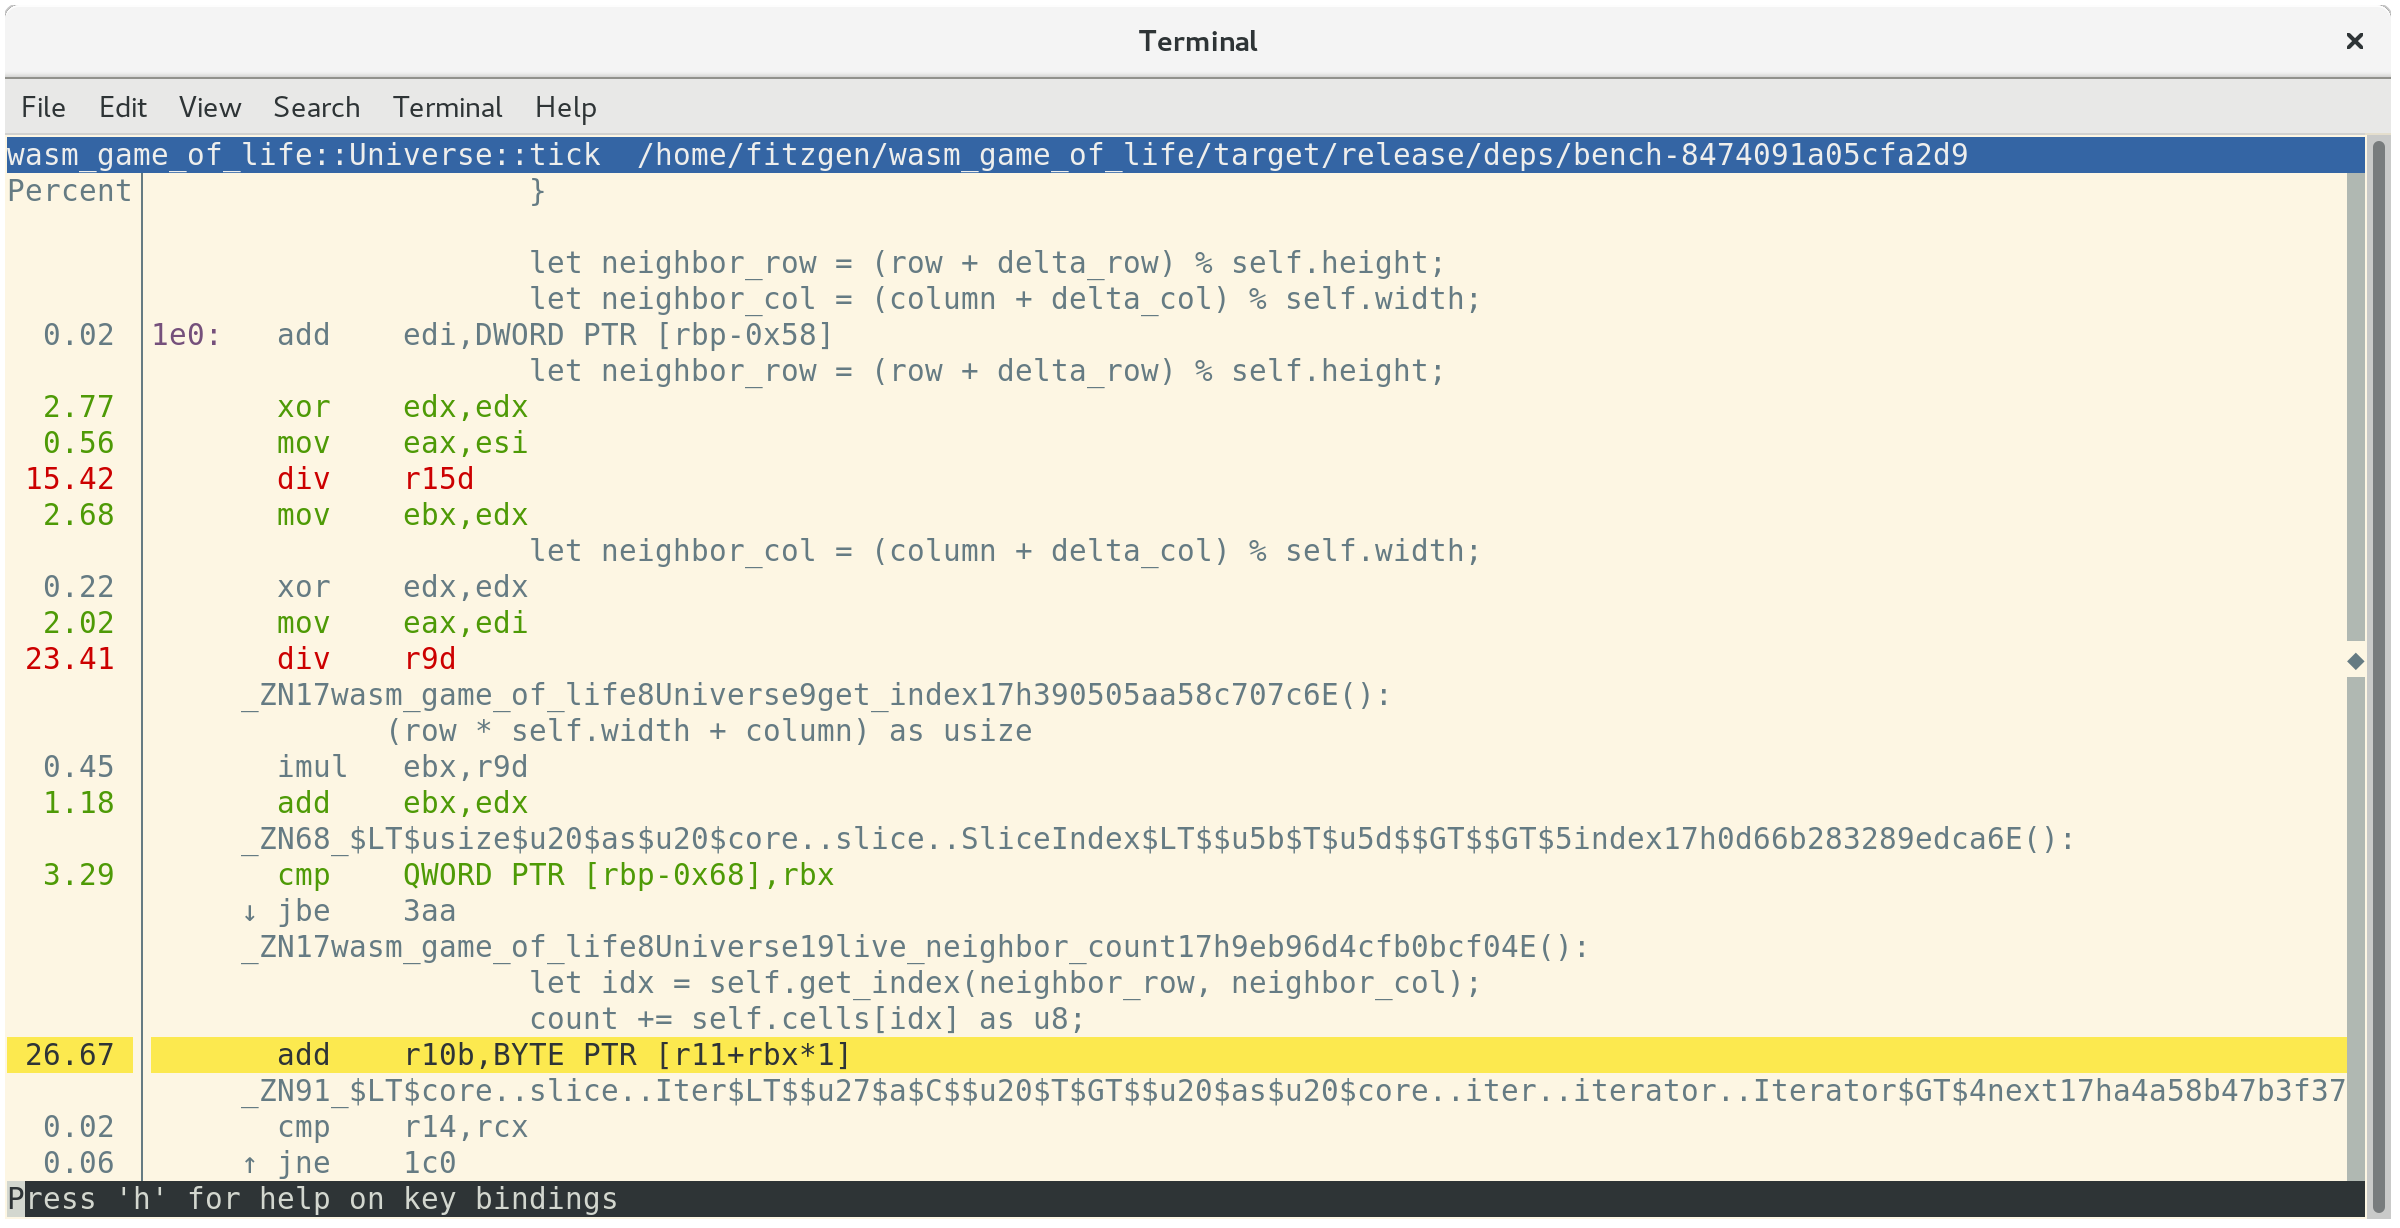
This tells us that 26.67% of time is being spent summing neighboring cells'values, 23.41% of time is spent getting the neighbor's column index, and another15.42% of time is spent getting the neighbor's row index. Of these top threemost expensive instructions, the second and third are both costly divinstructions. These divs implement the modulo indexing logic inUniverse::live_neighbor_count.
Recall the live_neighbor_count definition insidewasm-game-of-life/src/lib.rs:
# #![allow(unused_variables)]#fn main() {fn live_neighbor_count(&self, row: u32, column: u32) -> u8 {let mut count = 0;for delta_row in [self.height - 1, 0, 1].iter().cloned() {for delta_col in [self.width - 1, 0, 1].iter().cloned() {if delta_row == 0 && delta_col == 0 {continue;}let neighbor_row = (row + delta_row) % self.height;let neighbor_col = (column + delta_col) % self.width;let idx = self.get_index(neighbor_row, neighbor_col);count += self.cells[idx] as u8;}}count}#}
The reason we used modulo was to avoid cluttering up the code with if branchesfor the first or last row or column edge cases. But we are paying the cost of adiv instruction even for the most common case, when neither row nor columnis on the edge of the universe and they don't need the modulo wrappingtreatment. Instead, if we use ifs for the edge cases and unroll this loop, thebranches should be very well-predicted by the CPU's branch predictor.
Let's rewrite live_neighbor_count like this:
# #![allow(unused_variables)]#fn main() {fn live_neighbor_count(&self, row: u32, column: u32) -> u8 {let mut count = 0;let north = if row == 0 {self.height - 1} else {row - 1};let south = if row == self.height - 1 {0} else {row + 1};let west = if column == 0 {self.width - 1} else {column - 1};let east = if column == self.width - 1 {0} else {column + 1};let nw = self.get_index(north, west);count += self.cells[nw] as u8;let n = self.get_index(north, column);count += self.cells[n] as u8;let ne = self.get_index(north, east);count += self.cells[ne] as u8;let w = self.get_index(row, west);count += self.cells[w] as u8;let e = self.get_index(row, east);count += self.cells[e] as u8;let sw = self.get_index(south, west);count += self.cells[sw] as u8;let s = self.get_index(south, column);count += self.cells[s] as u8;let se = self.get_index(south, east);count += self.cells[se] as u8;count}#}
Now let's run the benchmarks again! This time output it to after.txt.
$ cargo bench | tee after.txtCompiling wasm_game_of_life v0.1.0 (file:///home/fitzgen/wasm_game_of_life)Finished release [optimized + debuginfo] target(s) in 0.82 secsRunning target/release/deps/wasm_game_of_life-91574dfbe2b5a124running 0 teststest result: ok. 0 passed; 0 failed; 0 ignored; 0 measured; 0 filtered outRunning target/release/deps/bench-8474091a05cfa2d9running 1 testtest universe_ticks ... bench: 87,258 ns/iter (+/- 14,632)test result: ok. 0 passed; 0 failed; 0 ignored; 1 measured; 0 filtered out
That looks a whole lot better! We can see just how much better it is with the benchcmp tool and the two text files we created before:
$ cargo benchcmp before.txt after.txtname before.txt ns/iter after.txt ns/iter diff ns/iter diff % speedupuniverse_ticks 664,421 87,258 -577,163 -86.87% x 7.61
Wow! 7.61x speed up!
WebAssembly intentionally maps closely to common hardware architectures, but wedo need to make sure that this native code speed up translates into aWebAssembly speed up as well.
Let's rebuild the .wasm with wasm-pack build and refreshhttp://localhost:8080/. On my machine, the page isrunning at 60 frames per second again, and recording another profile with thebrowser's profiler reveals that each animation frame is taking about tenmilliseconds.
Success!
Exercises
At this point, the next lowest hanging fruit for speeding up
Universe::tickis removing the allocation and free. Implement double buffering of cells,where theUniversemaintains two vectors, never frees either of them, andnever allocates new buffers intick.Implement the alternative, delta-based design from the "Implementing Life"chapter, where the Rust code returns a list of cells that changed states toJavaScript. Does this make rendering to
<canvas>faster? Can you implementthis design without allocating a new list of deltas on every tick?As our profiling has shown us, 2D
<canvas>rendering is not particularlyfast. Replace the 2D canvas renderer with a WebGL renderer. How much faster isthe WebGL version? How large can you make the universe before WebGL renderingis a bottleneck?