Querying Metrics from Prometheus
This task shows you how to query for Istio Metrics using Prometheus. As part ofthis task, you will use the web-based interface for querying metric values.
The Bookinfo sample application is used asthe example application throughout this task.
Before you begin
Install Istio in your cluster and deploy anapplication.
Querying Istio Metrics
- Verify that the
prometheusservice is running in your cluster.
In Kubernetes environments, execute the following command:
$ kubectl -n istio-system get svc prometheusNAME CLUSTER-IP EXTERNAL-IP PORT(S) AGEprometheus 10.59.241.54 <none> 9090/TCP 2m
- Send traffic to the mesh.
For the Bookinfo sample, visit http://$GATEWAY_URL/productpage in your webbrowser or issue the following command:
$ curl http://$GATEWAY_URL/productpage
$GATEWAY_URL is the value set in the Bookinfo example.
- Open the Prometheus UI.
In Kubernetes environments, execute the following command:
$ kubectl -n istio-system port-forward $(kubectl -n istio-system get pod -l app=prometheus -o jsonpath='{.items[0].metadata.name}') 9090:9090 &
Visit http://localhost:9090/graph in your web browser.
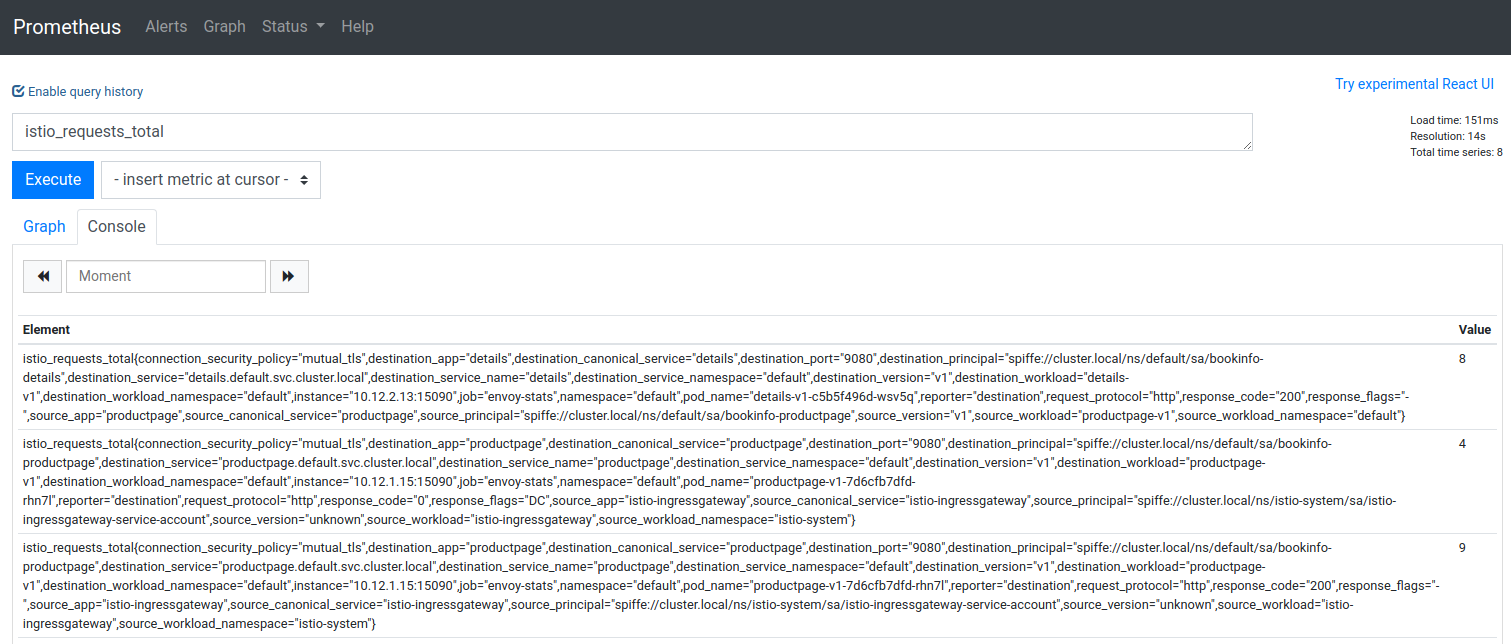
- Execute a Prometheus query.
In the “Expression” input box at the top of the web page, enter the text:istio_requests_total. Then, click the Execute button.
The results will be similar to:
Other queries to try:
- Total count of all requests to the
productpageservice:
istio_requests_total{destination_service="productpage.default.svc.cluster.local"}
- Total count of all requests to
v3of thereviewsservice:
istio_requests_total{destination_service="reviews.default.svc.cluster.local", destination_version="v3"}
This query returns the current total count of all requests to the v3 of the reviews service.
- Rate of requests over the past 5 minutes to all instances of the
productpageservice:
rate(istio_requests_total{destination_service=~"productpage.*", response_code="200"}[5m])
About the Prometheus add-on
Mixer comes with a built-in Prometheus adapter thatexposes an endpoint serving generated metric values. The Prometheus add-on is aPrometheus server that comes preconfigured to scrape Mixer endpoints to collectthe exposed metrics. It provides a mechanism for persistent storage and queryingof Istio metrics.
The configured Prometheus add-on scrapes the following endpoints:
istio-telemetry.istio-system:42422: Theistio-meshjob returns all Mixer-generated metrics.istio-telemetry.istio-system:15014: Theistio-telemetryjob returns all Mixer-specific metrics. Use this endpoint to monitor Mixer itself.istio-proxy:15090: Theenvoy-statsjob returns raw stats generated by Envoy. Prometheus is configured to look for pods with theenvoy-promendpoint exposed. The add-on configuration filters out a large number of envoy metrics during collection in an attempt to limit the scale of data by the add-on processes.istio-pilot.istio-system:15014: Thepilotjob returns the Pilot-generated metrics.istio-galley.istio-system:15014: Thegalleyjob returns the Galley-generated metrics.istio-policy.istio-system:15014: Theistio-policyjob returns all policy-related metrics.istio-citadel.istio-system:15014: Theistio-citadeljob returns all Citadel-generated metrics.For more on querying Prometheus, please read their queryingdocs.
Cleanup
- Remove any
kubectl port-forwardprocesses that may still be running:
$ killall kubectl
- If you are not planning to explore any follow-on tasks, refer to theBookinfo cleanup instructionsto shutdown the application.
相关内容
This task shows you how to configure Istio to collect and customize metrics.
本任务展示了如何配置 Istio 进行 TCP 服务的指标收集。
Improving availability and reducing latency.
Provides an overview of Mixer's plug-in architecture.
了解如何配置代理以向 Jaeger 发送追踪请求。
How to configure the proxies to send tracing requests to LightStep.