Zipkin
After completing this task, you understand how to have your application participate in tracing with Zipkin,regardless of the language, framework, or platform you use to build your application.
This task uses the Bookinfo sample as the example application.
To learn how Istio handles tracing, visit this task’s overview.
Before you begin
- To set up Istio, follow the instructions in the Installation guideand then configure:
a) a demo/test environment by setting the —set values.tracing.enabled=true and —set values.tracing.provider=zipkin install options to enable tracing “out of the box”
b) a production environment by referencing an existing Zipkin instance and then setting the —set values.global.tracer.zipkin.address=<zipkin-collector-service>.<zipkin-collector-namespace>:9411 install option.
When you enable tracing, you can set the sampling rate that Istio uses for tracing.Use the pilot.traceSampling option to set the sampling rate. The default sampling rate is 1%.
- Deploy the Bookinfo sample application.
Accessing the dashboard
Remotely Accessing Telemetry Addons details how to configure access to the Istio addons through a gateway. Alternatively, to use a Kubernetes ingress, specify the option —set values.tracing.ingress.enabled=true during install.
For testing (and temporary access), you may also use port-forwarding. Use the following, assuming you’ve deployed Zipkin to the istio-system namespace:
$ kubectl -n istio-system port-forward $(kubectl -n istio-system get pod -l app=zipkin -o jsonpath='{.items[0].metadata.name}') 15032:9411
Open your browser to http://localhost:15032.
Generating traces using the Bookinfo sample
- When the Bookinfo application is up and running, access
http://$GATEWAY_URL/productpageone or more timesto generate trace information.
To see trace data, you must send requests to your service. The number of requests depends on Istio’s sampling rate.You set this rate when you install Istio. The default sampling rate is 1%. You need to send at least 100 requests before the first trace is visible.To send a 100 requests to the productpage service, use the following command:
$ for i in `seq 1 100`; do curl -s -o /dev/null http://$GATEWAY_URL/productpage; done
- From the top panel, select a service of interest (or ‘all’) from the Service Name drop-down list and clickFind Traces:
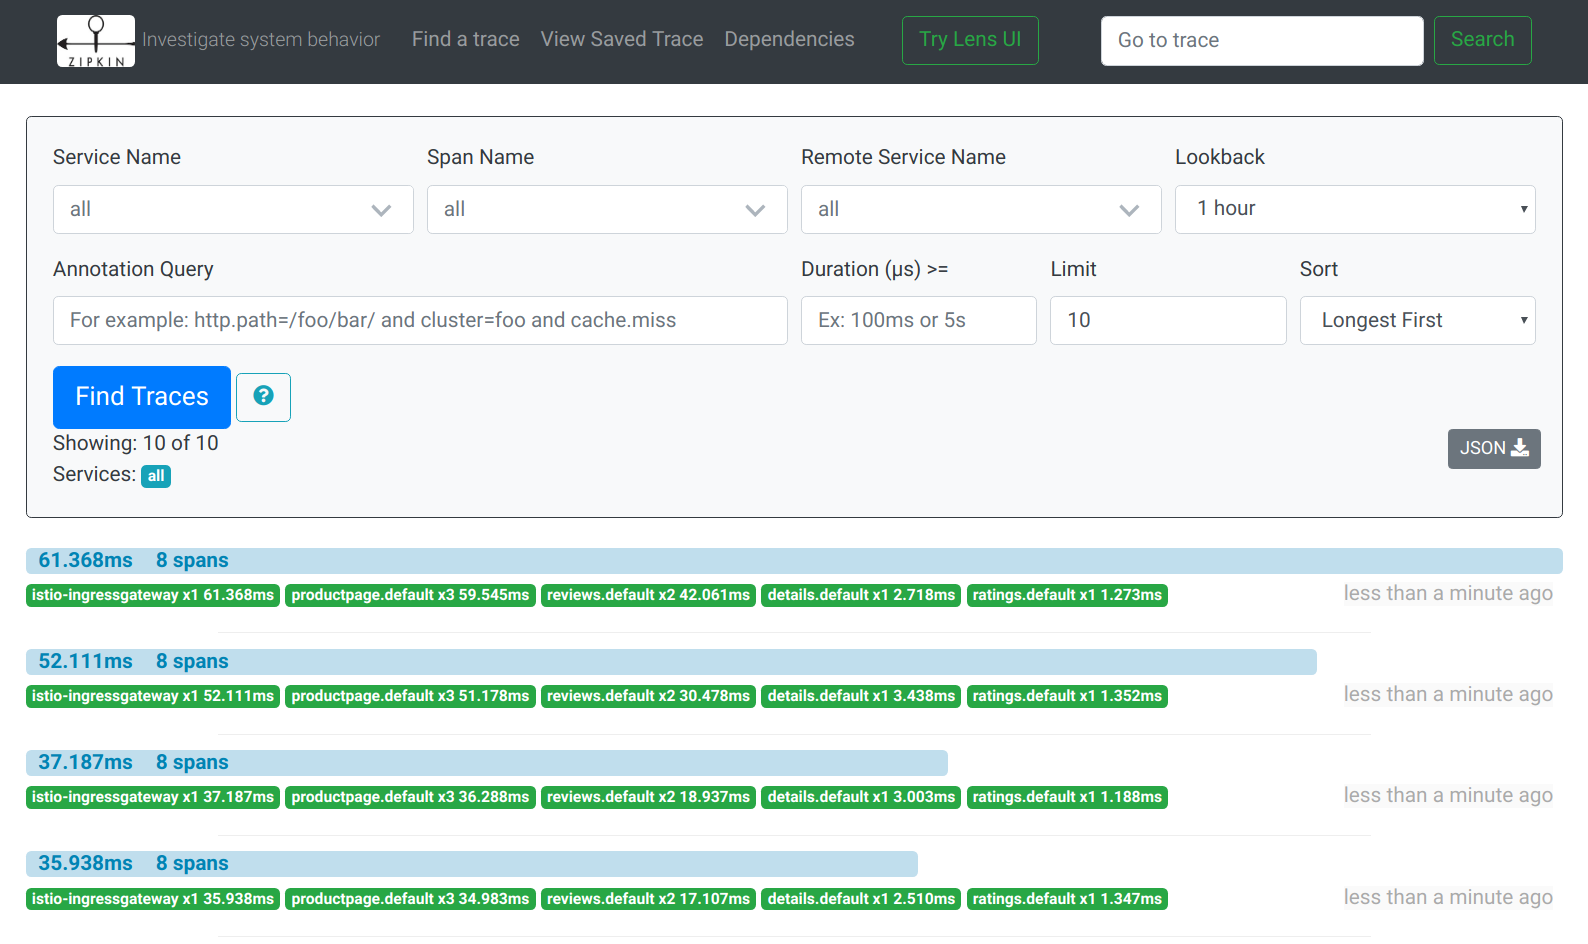 Tracing Dashboard
- Click on the most recent trace at the top to see the details corresponding to thelatest request to the
/productpage:
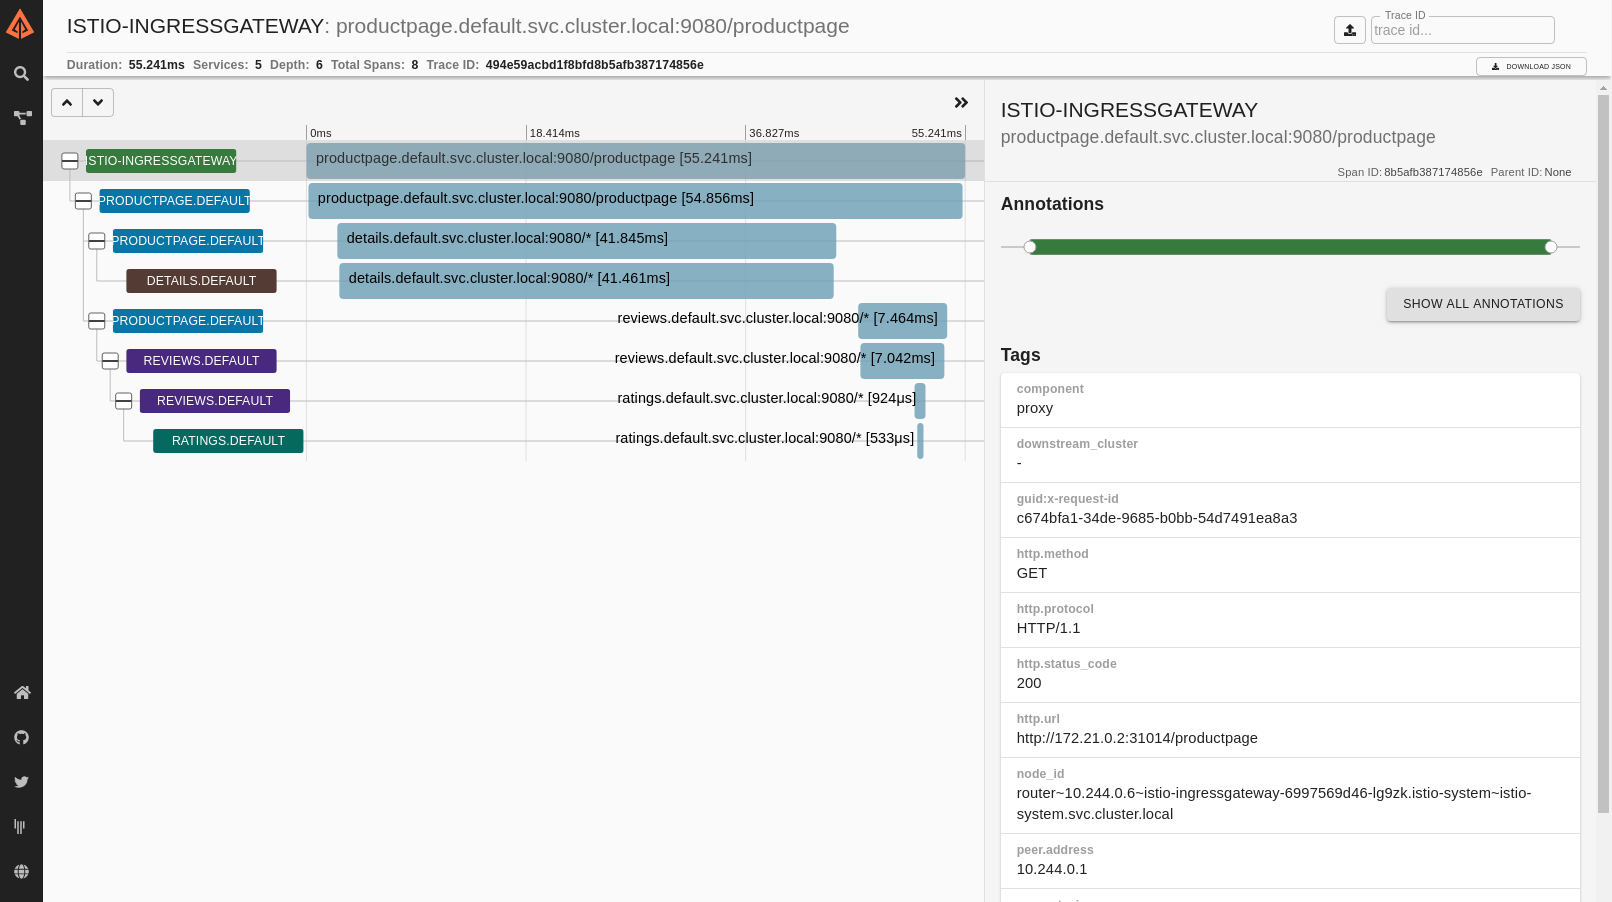 Detailed Trace View
- The trace is comprised of a set of spans,where each span corresponds to a Bookinfo service, invoked during the execution of a
/productpagerequest, orinternal Istio component, for example:istio-ingressgateway.
Cleanup
- Remove any
kubectl port-forwardprocesses that may still be running:
$ killall kubectl
- If you are not planning to explore any follow-on tasks, refer to theBookinfo cleanup instructionsto shutdown the application.
相关内容
了解如何配置代理以向 Jaeger 发送追踪请求。
Remotely Accessing Telemetry Addons
This task shows you how to configure external access to the set of Istio telemetry addons.
How to configure the proxies to send tracing requests to LightStep.
Overview of distributed tracing in Istio.
Improving availability and reducing latency.
Provides an overview of Mixer's plug-in architecture.